Download

1 / 16
160 likes | 239 Views
Professor David Gordon and Dr Eldin Fahmy Townsend Centre for International Poverty Research University of Bristol. Updating The Fuel Poverty Indicator For England. First developed by CSE and UoB, using 1991 Census and 1996 EHCS data Existing FPI widely used for:

E N D
Professor David Gordon and Dr Eldin FahmyTownsend Centre for International Poverty ResearchUniversity of Bristol Updating The Fuel Poverty Indicator For England
First developed by CSE and UoB, using 1991 Census and 1996 EHCS data Existing FPI widely used for: Identifying the small areas with highest needs Targeting fuel poverty programmes at a local level More than 1,100 data downloads (July 03) Used by 200+ local authorities Changes in Census and EHCS data have resulted in more reliable and accurate estimates: 2001 Census Output Area Geography Improvements to 2001 Census indicators Ability to link postcoded house price data to the 2001 Census Improvements in energy use modelling and income measurement in EHCS Why Update the Fuel Poverty Indicator?
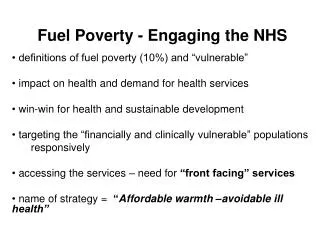
What Exactly Do We Mean By Fuel Poverty? “A household is said to be in fuel poverty if it needs to spend more than 10 per cent of its income on fuel to maintain a satisfactory heating regime (21°C in main living areas / 18 °C in other rooms)” • Basic Income Fuel Poverty = Total household income (incl. winter fuel payments): excludes income related directly to housing • Full Income Fuel Poverty = Total household income including income from: • Housing Benefit • Income Support Mortgage Interest • Mortgage Payment Protection Insurance • Council Tax Benefit • Less payment of Council Tax
The following groups are especially vulnerable: Unemployed households (HRP) Under-occupied households Household without a car Single pensioners Households without central heating Lone parents Disabled people LA and private renters Who Is Most At Risk of Fuel Poverty? • Two groups are vulnerable to fuel poverty: • People with lows incomes • People with low/moderate incomes living in energy inefficient housing
Estimating the Risk of Fuel PovertyUnivariate and Multivariate Odds (Full Income) Data: 2003 EHCS households
Basic Income FPI is equal to: 1.3% of hhlds in properties less than £80,000 + 1.1% of routine/semi-routine employees (HRP) + 1.4% of single pensioner hhlds + 4.7% of single non-pensioner hhlds + 3.7% of lone parent hhlds + 1.9% of private rental hhlds + 1.1% of council tenants + 5.0% of hhlds where HRP is not in work + 1.3% of hhlds in pre-WW1 dwellings + 1.0% of hhlds lacking central heating + 1.1% of hhlds lacking educ. qualifications (HRP) + 1.0% of under-occupied dwellings + 1.7% of one-person hhlds with 7+ rooms + 2.8% of detached pre-WW1 dwellings Applying the Models: Basic Income FPI
Applying the Models: Full Income FPI Full Income FPI is equal to: 0.8% of hhlds in properties less than £80,000 + 0.6% of routine/semi-routine employee hhlds (HRP) + 1.3% of single pensioner hhlds + 3.0% of single non-pensioner hhlds + 1.6% of lone parent hhlds + 0.9% of private rental hhlds + 3.3% of hhlds in where HRP is not in work + 1.2% of hhlds living in pre-WW1 dwellings + 1.0% of hhlds lacking central heating + 1.2% of hhlds without educ. qualifications + 1.5% of under-occupied dwellings + 1.3% of one-person hhlds with 7+ rooms + 2.2% of hhlds in detached pre-WW1 dwellings
Maps of Basic and Full Income FPI at MSOA Level, 2001 Census data Basic Income FPI Full Income FPI
EHCS is not designed to accurately measure household income EHCS income model differs from measures used in other Government surveys: Income is not adjusted (equivalised) for household composition and sizes Assumes reported household incomes less than the Income Support threshold to be miss-reported Further work explores how the rate and geography of fuel poverty changes if Household incomes are adjusted to need (equivalised) Households with very low incomes are assumed to have reported their incomes correctly These changes to the 2001 EHCS Income Model make results more comparable with other surveys (e.g. FRS, EFS) Alternative Definitions and Measures of Fuel Poverty
The overall rate of fuel poverty is not very sensitive to the way Full and Basic Incomes are measured BUT the Official FPI places greater emphasis upon: Single person households Single pensioner households Under-occupied households The HBAI-FPI places greater emphasis upon: Households containing large families Overcrowded households Households in urban areas (esp. London) Household in remote rural areas (Southwest, East Anglia, Northumbria, etc.) Vulnerability to Fuel Poverty:Full Income FPI vs. HBAI FPI
Maps of Basic and Full Income HBAI-FPI at MSOA Level, 2001 Census data Basic Income HBAI-FPI Full Income HBAI-FPI
The Effects of Changing Definitions and Measures Full Income FPI vs HBAI Full FPI
The ability to find and target households suffering fuel poverty is vital in eliminating fuel poverty The new FPI should help policy makers and programme managers to target resources at areas of greatest need BUT results are ‘best estimates’ and need to be interpreted in the light of local knowledge and expertise Changes in measurement of incomes also affect the composition and geography of fuel poverty… If the FPI is used to inform the allocation of resources then the official indicator is preferred It is always useful to investigate consistency in estimates between the different approaches Conclusions: Which Indicator to Use?
Professor David Gordon and Dr Eldin FahmyTownsend Centre for International Poverty ResearchUniversity of Bristol Updating The Fuel Poverty Indicator For England