Download
1 / 35
490 likes | 1.17k Views
Viable population : population capable of self-maintenance without continuing manipulation or intervention. Minimum viable population (MVP). Survival probability of a population of a given size for a designated period of time. Minimum viable population (MVP).

E N D
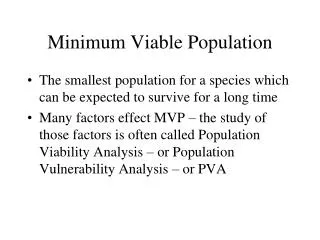
Viable population: population capable of self-maintenance without continuing manipulation or intervention
Minimum viable population (MVP) • Survival probability of a population of a given size for a designated period of time
Minimum viable population (MVP) • Survival probability of a population of a given size for a designated period of time • specific to individual species and location; no universal MVP exists
Minimum viable population (MVP) Key issues: • effect of chance events on population persistence • time frame for conservation • probability level desired
Minimum viable population (MVP) Key issues: • effect of chance events on population persistence - scientific issue • time frame for conservation value • probability level desired judgments
Minimum viable population (MVP) Example: red-cockaded woodpecker • live in colonies (breeding pair plus helper offspring) requiring about 215 acres • management plan across species range: 500 individuals needed in each of 15 populations
Minimum viable population (MVP) Example: red-cockaded woodpecker • live in colonies (breeding pair plus helper offspring) requiring about 215 acres • management plan across species range: 500 individuals needed in each of 15 populations • S. Carolina deme had mean time to extinction of 41.5 yrs, 72% probability of extinction within 200 yrs • annual addition of 3F + 2M for 10 years doubled projected mean time to extinction; probability of extinction in 200 yrs reduced to 4%
Population viability analysis (PVA) • A process to determine the probability that a population of a given size will go extinct within a given number of years • Used to identify strategies for conservation
Population viability analysis - estimating MVP’s • experimentation + powerful, species-specific tool • ethical issues for endangered species • takes too long: conservation plans needed within a decade or two
Population viability analysis - estimating MVP’s • simulation models + allow estimation of extinction probability (run 1,000 simulations, tally number of extinction events) + indicates which factors are most important in declines • requires large amounts of data • not generalizable - build anew for each species
Population viability analysis - estimating MVP’s • simulation models + allow estimation of extinction probability (run 1,000 simulations, tally number of extinction events) + indicates which factors are most important in declines • requires large amounts of data • not generalizable - build anew for each species • “off-the-shelf” programs available (VORTEX, GAPPS, RAMAS metapopulation)
Basic procedure Construct a computer simulation that projects the growth of the population into the future. Select population growth rate for each time step at random from a distribution or set of possible growth rates. This will result in ‘good years’ and ‘bad years’. Repeat the project ion (e.g., 1000 x ) to estimate what the population is likely to do on average.
Population viability analysis • simulation models • Bay checkerspot butterfly current pop’n. trajectory result of simulations (only 3 shown) at current mean rate of population growth (r = 0.002)
Grizzly bears, the ‘original PVA’ – evaluating a single population
Bighorn sheep – evaluating a single population Percentage of populations of bighorn sheep in North America that persist over a 70-year period reduces with initial population size.
Koalas in Australia – comparing multiple populations • Koalas are globally IUCN ‘least concern’; secure in some areas, but threatened in others in Australia. • National management strategy to retain viable populations. • Two populations modeled for viability by Penn et al. (2000): Oakey (declining) and Springsure (secure). • Populations modeled from 1970s to 1990s to estimate extinction probabilities (1000 iterations). Koala – Phascolarctoscinereus
Variables in PVA Values used as inputs for simulations of koala populations at Oakey (declining) and Springsure (secure), Australia. Values in parentheses are SD due to environmental variation. The model procedure involved the selection of values at random from the range. Catastrophes are assumed to occur with a certain probability- in years when the model selects a catastrophe, reproduction and survival are reduced by the multipliers shown.
Probability of extinction • Oakey=0.380 (380 out of 1000 iterations). • Springsure=0.063 Observed koala population trends (diamonds) compared with trajectories (triangles ± 1SD) predicted by 1000 iterations at (a) Oakey and (b) Springsure, Australia.
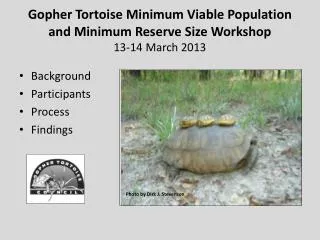
Elephants – determining reserve size • African elephants are IUCN Vulnerable. • Armbruster and Lande (1992) modeled population viability in 12 5-year age classes through discrete 5-year time steps. • Survivorship and reproductive rates derived from Tsavo NP Kenya. • Environmental stochasticity modeled as drought based on Tsavo data. • Habitat area and probability of extinction examined in 1000-year simulations. African elephant – Loxodontaafricana
Results suggest that an area of 1300 km2 is required to yield a 99% probability of persistence for 1000 years.
Puerto Rican Parrot (endangered) Declined due to poaching (pet trade), predation, cyclones, to N = ~13 birds
Puerto Rican Parrot (endangered) 13-14 animals in wild; captive pop’n started PVA: with 40 birds, 30% prob. of extinction in 100 yrs - primary risk: catastrophe (hurricanes)
Puerto Rican Parrot (endangered) 13-14 animals in wild; captive pop’n started PVA: 30% prob. of extinction in 100 yrs primary risk: catastrophe (hurricanes) Strategy: stockpile food establish 5 populations
Puerto Rican Parrot (endangered) 13-14 animals in wild; captive pop’n started PVA: 30% prob. of extinction in 100 yrs primary risk: catastrophe (hurricanes) Outcome: hurricane devastated forest habitat; captive population saved due to food stockpile
Puerto Rican Parrot (endangered) 13-14 animals in wild; captive pop’n started PVA: 30% prob. of extinction in 100 yrs primary risk: catastrophe (hurricanes) Issues: population fragmentation, diseases from captive birds
Florida panther: PVA inputs: population size sex ratio age distribution of each sex age at first reproduction maximum breeding age % of each sex breeding each year sex ratio at birth mating strategy number of offspring per year probability of survival at each age harvest probability of catastrophic events estimated carrying capacity
Florida panther: declined due to habitat loss, poaching, road kills evidence of inbreeding: low fertility, sperm abnormalities, cowlicks, kinked tails, cardiac defects, undescended testicles, high disease rate 1989 PVA: at N < 50, predicted decline of 6-10%/year, extinction in 25-40 yrs - possible earlier extinction due to disease
Florida panther: Outbred with sub-species from Texas - added 8 females in 1995 F1 hybrid kittens do not have cowlinks or kinked tails Texas genes are now 15-29% of total Road kills lower due to addition of culverts PVA in 1999: extinction probability much lower
PVAs – a work in progress. . . Proportion of recovery plans written for species listed under the US Endangered Species Act that present information regarding PVA.
PVA limitations • Accuracy depends on quality of data. • Lack of data on variables problematic. Criteria for successful (accurate) PVAs • Available data must be of sufficiently high quality to yield accurate descriptions of all parameter distributions (e.g., population growth rates or rates of survival and reproduction. • Distributions of population parameters must hold fairly constant into the future. PVA assumes that future population dynamics will be similar to those captured in the data in hand, which reflect past trends. Greater kudu - Tragelaphusstrepsiceros
Mammalian PVAs The predicted area required to support a given minimum population size varies with • the mammal’s feeding ecology (herbivore vs. carnivore) • the mammal’s environment • temperate vs. tropic (area required is larger for tropical species) • high environmental variance requires more area
Mammalian PVAs The predicted area required to support a given minimum population size varies with • the mammal’s feeding ecology (herbivore vs. carnivore) • the mammal’s environment • temperate vs. tropic (area required is larger for tropical species) • high environmental variance requires more area In general, • larger mammals require smaller populations, but larger habitat areas • carnivores require more habitat area than herbivores • populations with more variation in growth rate must be larger to persist. • densities tend to be lower in tropics (may be due to greater spp. diversity, leading to greater number & intensity of biotic interactions)
Model predictions about species persistence in • the parks of the world • (Frankel & Soulé 1981 - Conservation and Evolution) • For largest mammalian carnivores (10-100 kg) • 0-22% of parks should permit persistence for 100 yrs • no parks expected to permit persistence for 1000 yrs • For largest mammalian herbivores (100-1000 kg) • 4-100% of parks should permit persistence for 100 yrs • 0-22% of parks should permit persistence for 1000 yrs