Download
1 / 46
460 likes | 533 Views
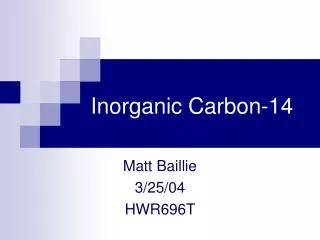
INORGANIC CARBON AND ACIDIFICATION DYNAMICS IN WESTERN GULF OF MAINE SURFACE WATERS. J. Salisbury, D. Vandemark, C. Hunt, S. Shellito (Univ. of New Hampshire) W. R. McGillis (Columbia Univ./LDEO) C. L. Sabine (NOAA/PMEL). Atmospheric carbon dioxide record from Mauna Loa for 1958-2000

E N D
INORGANIC CARBON AND ACIDIFICATION DYNAMICS IN WESTERN GULF OF MAINE SURFACE WATERS. J. Salisbury, D. Vandemark, C. Hunt, S. Shellito (Univ. of New Hampshire) W. R. McGillis (Columbia Univ./LDEO) C. L. Sabine (NOAA/PMEL)
Atmospheric carbon dioxide record from Mauna Loa for 1958-2000 by C.D. Keeling and T.P. Whorf http://cdiac.esd.ornl.gov/trends/co2/sio-mlo.htm Average for year 2000 = 369.4ppm
Outline Our place and our observation kit Background on CO2 and acid variability and western GOM Ideas on variability from our data set Coastal acidification Conclusions and questions
Our Science Questions • Is the Gulf of Maine a source or sink of atmospheric CO2? • What are the space/time variability and mechanistic controls of surface pCO2 and subsequent acidification? • Can we apply CO2 and O2 data to support monitoring/prediction of lower trophic status via net ecosystem metabolism estimates? Climate and the Integrated Ocean Observing System ( First of the Seven IOOS Societal Goals ) 1. Improve predictions of climate change and weather and their effects on coastal communities and the nation
UNH COOA study region within NERACOOS
Two monthly cruises since 2004 1) cross-shore out to Wilkinson Basin and 2) along-shore up into the Kennebec River. • Suite of variables: • Optical properties • Phytoplankton pigments (HPLC) • Zooplankton biomass and species • Nutrients and oxygen • Inorganic and organic carbon (pCO2, DIC, TA, pH, DOC) • Temperature • Salinity
COOA monthly Gulf of Maine ecosystem observations 2004 - now, Phys/Bio/Chem UNH R/V Gulf Challenger Profilers for IOPs , AOPs, and CTD Fast-rate pCO2 equilibrator Underway pCO2, oxygen, IOPs, NO3 and CTD Infrared pCO2 gas analyzer
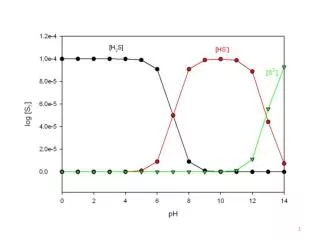
Some background: CO2 Reactions with water CO2 (air) -------------------------------------------------- Sea Surface ---- CO2 + H2O H2CO3 H++ HCO3- 2H+ + CO3= CaCO3 (solid) K*2 K*1 Add Ca++ Note: DIC or CO2 is the sum of CO2(aq), HCO3- and CO32-
Solubility a function of temperature and “salinity” ≈ [Ca++] [CO3--] agaronite Ksp Aragonite saturation state: In simple terms, Ω is a measure of the product of the concentrations of CO32- and Ca2+ ions relative to the amount of aragonite that can be dissolved at a given temperature, salinity and pressure.
CO2 gas flux at air-sea interface Typical parameterization - flux (mmolC/m2/hr) = α* k * (ΔpCO2) α = gas solubility; known quantity f(T,S) k = gas transfer coefficient; an unknown at sea and empirically related to wind speed (U) ΔpCO2 = pCO2atmosphere– pCO2aqueous pCO2 = partial pressure of CO2 gas ~387 Atm
Lower Higher J F M A M J J A S O N D SST NCP (P-R) Wind speed Main variables affecting temporal variability of DIC, and air-sea exchange in W. Gulf of Maine
The role of river discharge? Influence spring stratification … and impart resistance to mixing …often has a different temperature signature Potential subsides of nutrients, DOC, acid … and deficits of DIC and alkalinity
Interesting cases: Do they affect the annual budget? Effect of discharge on the onset and persistence of two spring blooms? (2004 and 2005) Turbulent interruption of a spring bloom (2006) Timing of the fall turnover could be a significant factor influencing the annual CO2 flux (2007).
Case1. Blooms of different duration (2004-2005) Salinity Inflection 3/05/04, SST ~3.0C Persistence 115 days Inflection 2/13/05, SST ~2.0C Persistence 155 days Surface f-chlorophyll ? Salinity and f-chlorophyll at GOMOOS Buoy B
Comparison of conditions (surface 10m) during April 19-June 18 (2004 and 2005) Focus on the productive seasons of 2004 and 2005 Estimate 2004 2005 Average plume (HFW) region area (km2) 17630 23596 Average freshwater volume (km3)* 6.8 39.5 Average DICbio depletion (ml kg-1) -1.27 -13.97 Net DICbio accumulation (mol) in region of interest (plume and non-plume) -0.48E8 -1.33E8 Biologically mediated DIC and air-sea flux Salisbury et al., 2008
Comparison of conditions (surface 10m) during April 19-June 18 (2004 and 2005) Estimate 2004 2005 Average plume (HFW) region area (km2) 17630 23596 Average freshwater volume (km3)* 6.8 39.5 Average DICbio depletion (ml kg-1) -1.27 -13.97 Net DICbio accumulation (mol) in region of interest (plume and non-plume) -0.48E8 -1.33E8 Salisbury et al., 2008
10m waves Case 2: Patriot’s Day Storm (2006) A serious interruption of the spring bloom
Evidence for storm induced mixing of shallow and deep DIC pools Start of mixing > 20m
Coastal acid dynamics Joe Salisbury, Mark Green, Doug Vandemark, Chris Hunt It’s not just and air-sea issue
Most soils are acidic • Decaying plant material • Weathering of minerals • Atmospheric deposition
Simulation: Hold SST at median SST (16.1º C) Subtract result from original image
Simulation: Hold pCO2 at the mean atmospheric value (384uatm) Subtract result from original image
Simulation: Hold TA at the 90th prctile Subtract result from original image
Closing remarks Operational Salinity model Huijie Xue (UMO)
Important stuff I didn’t cover very well • PAR (effect of clouds) • Distribution of PAR in the water (effects of attenuation) • Community dynamics e.g. Phaeocystis has a C:N of 30 (Mykelstad, 1988)
Some conclusions/ questions Several week-to-month (event scale) processes impart lots of interannual variability. W. Gulf is a an overall air-sea source of CO2 but with interannual variability that can swing to a sink (annual flux numbers - unimpressive) Seasonal pCO2 cycle has large swings from spring drawdown to winter ventilation but we are near carbon neutral over the year Freshwater mixing and biology affect
Some questions • Why aren’t we a big sink for atmospheric CO2? • What role does freshwater play in carbon and acid dynamics? • What role do storms play?
data collection acknowledgments - a regional and local effort UNH/COOA measurement crew: P. Pelletier, B. Soares, D. Brewitt C. Manning R. Jones C. Hunt T. Gregory M. Novak S. Shellito and many more UNH WB transect PIs: J. Campbell R. Morrison J. Salisbury D. Vandemark J. Runge (GMRI) A. Bucklin (Uconn)