Download
1 / 12
120 likes | 126 Views
What Does It Do?. The Region 10 STORET Legacy System Provides for Dynamic Real-Time Analysis of Legacy STORET Data via the Web. Go Dynamically From: Interactive Web Maps of STORET Stations To Detailed Raw or Summary STORET Legacy Data

E N D
What Does It Do? The Region 10 STORET Legacy System Provides for Dynamic Real-Time Analysis of Legacy STORET Data via the Web • Go Dynamically From: • Interactive Web Maps of STORET Stations • To Detailed Raw or Summary STORET Legacy Data • To Reports and Charts of the Data Within a Web Browser • On the Fly Within Seconds!
How is this accomplished? • By Creating: • The STORET Legacy Data Warehouse • A database with over 90 Million Records of Grab, Composite, and Invent Data • Over 375,000 STORET Stations with data from Regions 4, 9, and 10 (17 States) • Specifically designed for extremely quick querying and access • The STORET Legacy Mapping Application • A web-enabled interactive mapping application • Displays the locations of the STORET stations in the STORET Legacy Data Warehouse • There is a direct link to and from the data warehouse through a web page • The STORET Legacy Web Query Interface • Sends/accepts calls to/from the STORET Legacy Mapping Application • Builds custom data warehouse queries for the user • Saves query output in tabular format • Allows the user to create reports and charts on the fly within the web browser
Dynamic Data Analysis For STORET! SAVE FILES O L A P EXCEL Produces Tabular Reports and Exports Them To Other Programs for Analysis Dynamically Analyze Data within the Web Browser Using PivotTables View Dynamic PivotCharts within The Web Browser What does the user do? One Senario Open the STORET Legacy Mapping Application Click on a STORET Station with the mouse The Map Click Launches STORET Legacy Query Interface and Supplies It with the Station The Query Interface Dynamically Queries The STORET Data Warehouse
The Remainder of This Presentation: • An Example of the Mapping Application (since we are unable to connect to our server for a live demo) • Examples of the STORET Legacy Data Warehouse and Query Interface • Discussion of the Data Warehouse Structure • Live Queries of the Data Warehouse If Time Permits
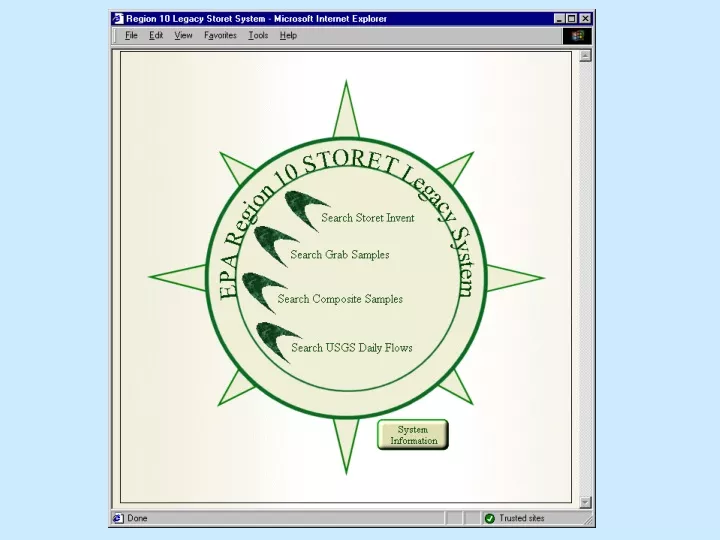
Launch the Region 10 Legacy STORET Mapping Application from within a web browser Zoom to an area of interest with the zoom button, for example the Lower Yakima Sub-basin Open Mapping Application Map Frame Legend Frame Table of Contents Frame Toolbar Frame
There are two STORET Layers, one represents wells, the other surface stations, these layers are derived from the Invent Data Mart. There is also a USGS Gage Layer. Notice the Clickable Layers and Scale-Dependent Information Notice the additional map detail as you zoom in you see more detailed streams, roads, sub-basin boundaries, etc… Notice the additional map layers in the table of contents that can be added to the map.
Notice the graduated symbology for the STORET stations and USGS gages based on the number of records. Zoom in Add the STORET Surface Stations, the USGS Gages, Anadromous Fish, and 303d Listed Waterbodies Add Detail to the Map
Set the STORET Station layer as the active layer. View the results which includes station information and summary information Use the Identify button and click on a station. Get Summary Information About a STORET Station The STORET Surface Stations are labeled in red, the USGS gages are blue.
Use the Hyperlinks Button to pass station information to the STORET Legacy Data Warehouse. Click on a station. Pass Station Information to the STORET Legacy Data Warehouse
The Hyperlink button in the mapping app opens the STORET Legacy Query Interface at the Invent Page and passes the station ID to the Warehouse for a query. Submit the query and get summary Invent information for each parameter sampled at the station. Query the STORET Legacy Data Warehouse
If you want to save the query results, to a file push the Save Results Tab This pops up the save window where you have two options for saving data or analyzing it. View the Results Within the Web Browser Within Seconds, Search Through 8+ Million Records and View the Tabular Output in the Web Page