Download
1 / 96
990 likes | 1.06k Views
Evaluating Diagnostic Tests. Payam Kabiri, MD. PhD. Clinical Epidemiologist Tehran University of Medical Sciences. Seven question to evaluate the utility of a diagnostic test. Can the test be reliably performed? Was the test evaluated on an appropriate population?

E N D
Evaluating Diagnostic Tests Payam Kabiri, MD. PhD. Clinical Epidemiologist Tehran University of Medical Sciences
Seven question to evaluate the utility of a diagnostic test Can the test be reliably performed? Was the test evaluated on an appropriate population? Was an appropriate gold standard used? Was an appropriate cut-off value chosen to optimize sensitivity and specificity?
Seven question to evaluate the utility of a diagnostic test What are the positive and negative likelihood ratios? How well does the test perform in specific populations? What is the balance between cost of the disease and cost of the test?
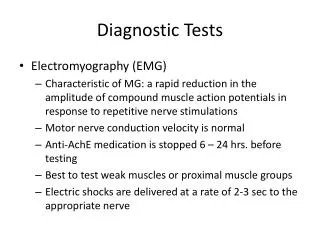
Diagnostic Tests Characteristics • Sensitivity • Specificity • Predictive Value • Likelihood Ratio
Validity of Screening Tests True Disease Status Results of Screening Test - + a b + - c d Sensitivity: The probability of testing positive if the disease is truly present Sensitivity = a / (a + c)
Validity of Screening Tests True Disease Status Results of Screening Test - + a b + - c d Specificity: The probability of screening negative if the disease is truly absent Specificity = d / (b + d)
Two-by-two tables can also be used for calculating the false positive and false negative rates. The false positive rate = false positives / (false positives + true negatives). It is also equal to 1- specificity.
The false negative rate = false negatives / (false negatives + true positives). It is also equal to 1 – sensitivity. An ideal test maximizes both sensitivity and specificity, thereby minimizing the false positive and false negative rates.
Validity of Screening Tests Breast Cancer - + Physical Exam and Mammo- graphy 132 983 + - 63650 45 Sensitivity:a / (a + c) Sensitivity = Specificity: d / (b + d) Specificity =
Validity of Screening Tests Breast Cancer - + Physical Exam and Mammo- graphy 132 983 + - 63650 45 Sensitivity:a / (a + c) Sensitivity = 132 / (132 + 45) = 74.6% Specificity: d / (b + d) Specificity = 63650 / (983 + 63650) = 98.5%
2 X 2 table Disease + - Positive predictive value + Test - Sensitivity
In Every 100 People, 4 Will Have The Disease If these 100 people are representative of the population at risk, the assessed rate of those with the disease (4%) represents the PREVALENCE of the disease – it can also be considered the PRE-TEST PROBABILITY of having the disease
OF THE 4 PEOPLE WITH THE DISEASE, THE TEST WILL DETECT 3 In other words, the sensitivity is 75%
AMONG THE 96 PEOPLE WITHOUT THE DISEASE, 7 WILL TEST POSITIVE In other words, the specificity is 93%
AMONG THOSE WHO TEST POSITIVE, 3 IN 10 WILL ACTUALLY HAVE THE DISEASE This is also the POST-TEST PROB- ABILITY of having the disease POSITIVE PREDICTIVE VALUE = 30%
AMONG THOSE WHO TEST NEGATIVE, 89 OF 90 WILL NOT HAVE THE DISEASE NEGATIVE PREDICTIVE VALUE = 99%
CONVERSELY, IF SOMEONE TESTS NEGATIVE, THE CHANCE OF HAVING THE DISEASE IS ONLY 1 IN 90
PREDICTIVE VALUES AND CHANGING PREVALENCE Prevalence reduced by an order of magnitude from 4% to 0.4%
PREDICTIVE VALUE AND CHANGING PREVALENCE Sensitivity and Specificity unchanged
POSITIVE PREDICTIVE VALUE AT LOW PREVALENCE Previously, PPV was 30% POSITIVE PREDICTIVE VALUE = 4%
NEGATIVE PREDICTIVE VALUE AT LOW PREVALENCE Previously, NPV was 99% NEGATIVE PREDICTIVE VALUE >99%
Prediction Of Low Prevalence Events • Even highly specific tests, when applied to low prevalence events, yield a high number of false positive results • Because of this, under such circumstances, the Positive Predictive Value of a test is low • However, this has much less influence on the Negative Predictive Value
Difference between PPV and NPV relatively small Relationship Between Prevalence and Predictive Value Difference between PPV and NPV relatively large Based on a test with 90% sensitivity and 82% specificity
Relationship Between Prevalence And Predictive Value Predictive Value Prevalence Based on a test with 75% sensitivity and 93% specificity
Performance of A Test With Changing Prevalence A : Sensitivity = Specificity = 0.9 LR+ = 9.0 B : Sensitivity = Specificity = 0.7 LR+ = 3.0 C : Sensitivity = Specificity = 0.5 LR+ = 1.0 POST-TEST PROBABILITY
Sensitivity FALSE NEGATIVES Sensitivity The proportion of people with the diagnosis (N=4) who are correctly identified (N=3) Sensitivity = a/(a+c) = 3/4 = 75%
Specificity FALSE POSITIVES Specificity The proportion of people without the diagnosis (N=96) who are correctly identified (N=89) Specificity = d/(b+d) = 89/96 = 93%
Prevalence (Probability) = 5% Sensitivity = 90% Specificity = 85% PV+ = 24% PV- = 99% Test not as useful when disease unlikely Prevalence (Probability) = 90% Sensitivity = 90% Specificity = 85% PV+ = 98% PV- = 49% Test not as useful when disease likely Value of a diagnostic test depends on the prior probability of disease
A Test With Normally Distributed Values Assessing the performance of the test assumes that these two distributions remain constant. However, each of them will vary (particularly through spectrum or selection bias) Test cut-off % of Group NON-DESEASED DISEASED Positive Negative Degree of ‘positivity’ on test
Performance of A Diagnostic Test NON-CASES CASES FALSE NEGATIVES Test cut-off FALSE POSITIVES % of Group NON-DESEASED DISEASED Positive Negative Degree of ‘positivity’ on test
Minimising False Negatives: A Sensitive Test NON-CASES CASES • Cut-off shifted to minimise false negatives ie to optimise sensitivity • CONSEQUENCES: • Specificity reduced • A Negative result from a seNsitive test rules out the diagnosis - snNout Test cut-off % of Group NON-DESEASED DISEASED Positive Negative Degree of ‘positivity’ on test
Minimising False Positives: A Specific Test • Cut-off shifted to minimise false positives ie to optimise specificity • CONSEQUENCES: • Sensitivity reduced • A Positive result from a sPecific test rules in the diagnosis - spPin Test cut-off % of Group NON-DESEASED DISEASED Positive Negative Degree of ‘positivity’ on test
Receiver Operating Characteristics (ROC) Non-diseased Diseased Threshold Evaluation Result Value Or Subjective Judgment Of Likelihood That Case Is Diseased
Non-diseased Centers Diseased Centers Threshold Test result value or subjective judgment of likelihood that case is diseased
more typically: Diseased Centers Non-diseased Centers Cutoff point
more typically: Diseased cases Non-diseased cases FP rate
more typically: Diseased Centers Non-diseased Centers TP rate
Non-diseased Centers TPF, sensitivity Threshold less aggressive mindset Diseased Centers FPF, 1-specificity
Non-diseased cases moderate mindset TPF, sensitivity Threshold Diseased cases FPF, 1-specificity
Non-diseased cases more aggressive mindset TPF, sensitivity Threshold Diseased cases FPF, 1-specificity
Threshold Non-diseased cases Entire ROC curve TPF, sensitivity Diseased cases FPF, 1-specificity
Entire ROC curve chance line TPF, sensitivity FPF, 1-specificity
Check this out:http://www.anaesthetist.com/mnm/stats/roc/Findex.htm
Pre-test & post-test probability Pre-test probability of disease can be compared with the estimated later probability of disease using the information provided by a diagnostic test. The difference between the previous probability and the later probability is an effective way to analyze the efficiency of a diagnostic method.
It tells you how much a positive or negative result changes the likelihood that a patient would have the disease. The likelihood ratio incorporates both the sensitivity and specificity of the test and provides a direct estimate of how much a test result will change the odds of having a disease
The likelihood ratio for a positive result (LR+) tells you how much the odds of the disease increase when a test is positive. The likelihood ratio for a negative result (LR-) tells you how much the odds of the disease decrease when a test is negative.