Download
1 / 12
120 likes | 331 Views
Introductory Module:. Setting the Scene – Speeding. Young drivers. Causes of death ages 15-19 years, NSW 2005. Data source: Australian Bureau of Statistics. Road Deaths. Other accidents (drowning, falls etc.). Causes of death ages 15-19 years, NSW 2005. 60. 50. 40.

E N D
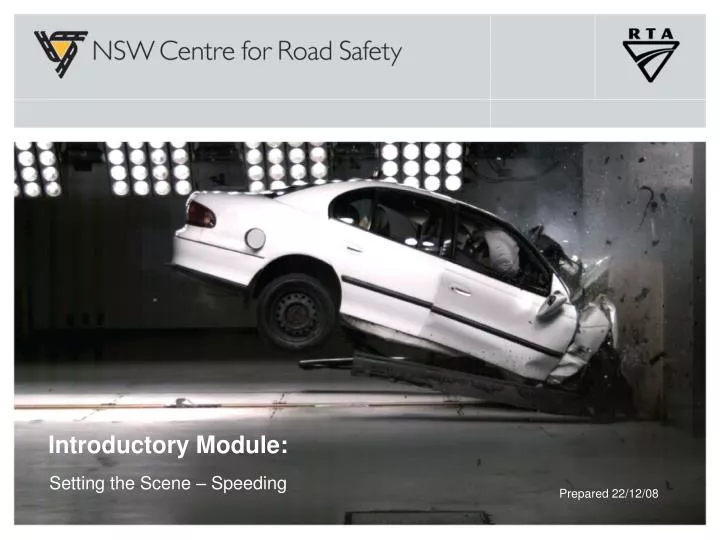
Introductory Module: Setting the Scene – Speeding
Causes of deathages 15-19 years, NSW 2005 Data source: Australian Bureau of Statistics
Road Deaths Other accidents (drowning, falls etc.) Causes of deathages 15-19 years, NSW 2005 60 50 40 Percentage of all deaths 30 20 10 Data source: Australian Bureau of Statistics 0 ? ?
Factors contributing to fatal crashes for drivers Data source: NSW CRS/RTA
Speeding the facts In NSW speeding is a factor in about 40 per cent of road deaths. This means around 200 people die each year from speed related crashes in NSW. Speeding was a factor in the deaths of 1049 people over the five years 2002–2006. In addition to those killed, more than 4700 people are injured in speed-related crashes each year.The cost of speeding is not only a human one. Speed-related crashes cost the community around $780 million each year. NSWCRS/RTA crash lab video. Click to play movie
Crash risks Speeding increases the risk of a crash and the severity of the crash outcome.The risk of causing death or injury in an urban 60km/h speed zone increases rapidly even with relatively small increases in speed. The crash risk at 65km/h is about twice the risk at 60km/h. At 70km/h, the crash risk is more than four times the risk at 60km/h. Speed – km/h Riskrelative to 60 km/h: 65km/h - Double 70km/h - 4 times 75km/h - 11 times 80km/h - 32 times
What are the consequences? NSWCRS/RTA video film clip: Speeding – the single most critical risk factor for young drivers. Click to play movie
Discussion questions What are the main messages you get from the video? Why do you think people speed? What are some of the consequences of speed? How can we start to change drivers’ attitudes towards speed?
Consequences • Each serious injury has long-term emotional and monetary costs both directly & in terms of lost income • Road death costs 3.6 billion in NSW annually • Every road death brings massive personal tragedy for family, friends & colleagues • Every road death = 50 road injuries • 8 of those 50 injuries = serious, permanent disability (brain, spinal, lost limbs). Data source: NSW CRS/RTA
As a driver or passenger, what can I do if a driver is speeding? • assertive behaviour • safe choices
The good news: • Total road deaths • …DOWN • SPEED-related deaths • … DOWN • Deaths from crashes involving young drivers or riders • …DOWN Total number of deaths on NSW roads Data source: NSW RTA