Download
1 / 1
10 likes | 181 Views

E N D
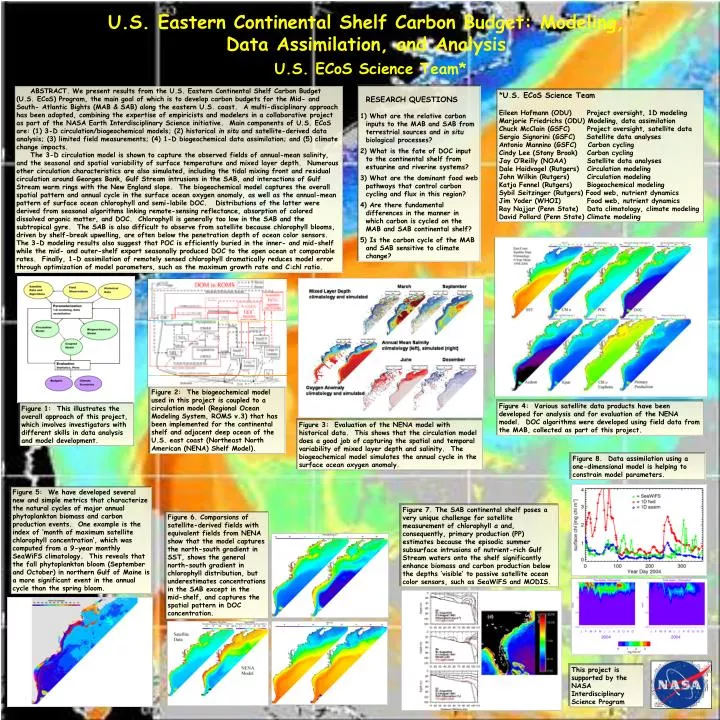
ABSTRACT. We present results from the U.S. Eastern Continental Shelf Carbon Budget (U.S. ECoS) Program, the main goal of which is to develop carbon budgets for the Mid- and South- Atlantic Bights (MAB & SAB) along the eastern U.S. coast. A multi-disciplinary approach has been adopted, combining the expertise of empiricists and modelers in a collaborative project as part of the NASA Earth Interdisciplinary Science initiative. Main components of U.S. ECoS are: (1) 3-D circulation/biogeochemical models; (2) historical in situ and satellite-derived data analysis; (3) limited field measurements; (4) 1-D biogeochemical data assimilation; and (5) climate change impacts. The 3-D circulation model is shown to capture the observed fields of annual-mean salinity, and the seasonal and spatial variability of surface temperature and mixed layer depth. Numerous other circulation characteristics are also simulated, including the tidal mixing front and residual circulation around Georges Bank, Gulf Stream intrusions in the SAB, and interactions of Gulf Stream warm rings with the New England slope. The biogeochemical model captures the overall spatial pattern and annual cycle in the surface ocean oxygen anomaly, as well as the annual-mean pattern of surface ocean chlorophyll and semi-labile DOC. Distributions of the latter were derived from seasonal algorithms linking remote-sensing reflectance, absorption of colored dissolved organic matter, and DOC. Chlorophyll is generally too low in the SAB and the subtropical gyre. The SAB is also difficult to observe from satellite because chlorophyll blooms, driven by shelf-break upwelling, are often below the penetration depth of ocean color sensors. The 3-D modeling results also suggest that POC is efficiently buried in the inner- and mid-shelf while the mid- and outer-shelf export seasonally produced DOC to the open ocean at comparable rates. Finally, 1-D assimilation of remotely sensed chlorophyll dramatically reduces model error through optimization of model parameters, such as the maximum growth rate and C:chl ratio. • RESEARCH QUESTIONS • What are the relative carbon inputs to the MAB and SAB from terrestrial sources and in situ biological processes? • 2) What is the fate of DOC input to the continental shelf from estuarine and riverine systems? • 3) What are the dominant food web pathways that control carbon cycling and flux in this region? • 4) Are there fundamental differences in the manner in which carbon is cycled on the MAB and SAB continental shelf? • 5) Is the carbon cycle of the MAB and SAB sensitive to climate change? *U.S. ECoS Science Team Eileen Hofmann (ODU) Project oversight, 1D modeling Marjorie Friedrichs (ODU) Modeling, data assimilation Chuck McClain (GSFC) Project oversight, satellite data Sergio Signorini (GSFC) Satellite data analyses Antonio Mannino (GSFC) Carbon cycling Cindy Lee (Stony Brook) Carbon cycling Jay O’Reilly (NOAA) Satellite data analyses Dale Haidvogel (Rutgers) Circulation modeling John Wilkin (Rutgers) Circulation modeling Katja Fennel (Rutgers) Biogeochemical modeling Sybil Seitzinger (Rutgers) Food web, nutrient dynamics Jim Yoder (WHOI) Food web, nutrient dynamics Ray Najjar (Penn State) Data climatology, climate modeling David Pollard (Penn State) Climate modeling U.S. Eastern Continental Shelf Carbon Budget: Modeling, Data Assimilation, and AnalysisU.S. ECoS Science Team* Source Latitude (North) Figure 1 Figure 2: The biogeochemical model used in this project is coupled to a circulation model (Regional Ocean Modeling System, ROMS v.3) that has been implemented for the continental shelf and adjacent deep ocean of the U.S. east coast (Northeast North American (NENA) Shelf Model). Figure 4: Various satellite data products have been developed for analysis and for evaluation of the NENA model. DOC algorithms were developed using field data from the MAB, collected as part of this project. Figure 1: This illustrates the overall approach of this project, which involves investigators with different skills in data analysis and model development. Figure 3: Evaluation of the NENA model with historical data. This shows that the circulation model does a good job of capturing the spatial and temporal variability of mixed layer depth and salinity. The biogeochemical model simulates the annual cycle in the surface ocean oxygen anomaly. Figure 8. Data assimilation using a one-dimensional model is helping to constrain model parameters. Figure 5: We have developed several new and simple metrics that characterize the natural cycles of major annual phytoplankton biomass and carbon production events. One example is the index of ‘month of maximum satellite chlorophyll concentration’, which was computed from a 9-year monthly SeaWiFS climatology. This reveals that the fall phytoplankton bloom (September and October) in northern Gulf of Maine is a more significant event in the annual cycle than the spring bloom. Figure 7. The SAB continental shelf poses a very unique challenge for satellite measurement of chlorophyll a and, consequently, primary production (PP) estimates because the episodic summer subsurface intrusions of nutrient-rich Gulf Stream waters onto the shelf significantly enhance biomass and carbon production below the depths ‘visible’ to passive satellite ocean color sensors, such as SeaWiFS and MODIS. Figure 6. Comparsions of satellite-derived fields with equivalent fields from NENA show that the model captures the north-south gradient in SST, shows the general north-south gradient in chlorophyll distribution, but underestimates concentrations in the SAB except in the mid-shelf, and captures the spatial pattern in DOC concentration. This project is supported by the NASA Interdisciplinary Science Program