Download
1 / 1
10 likes | 135 Views
Estimating vocal tract length from formant frequency data using a physical model and a latent variable factor analysis. P61. Richard E. Turner, Thomas C. Walters, and Roy D. Patterson. ret26@cam.ac.uk tcw24@cam.ac.uk rdp1@cam.ac.uk.

E N D
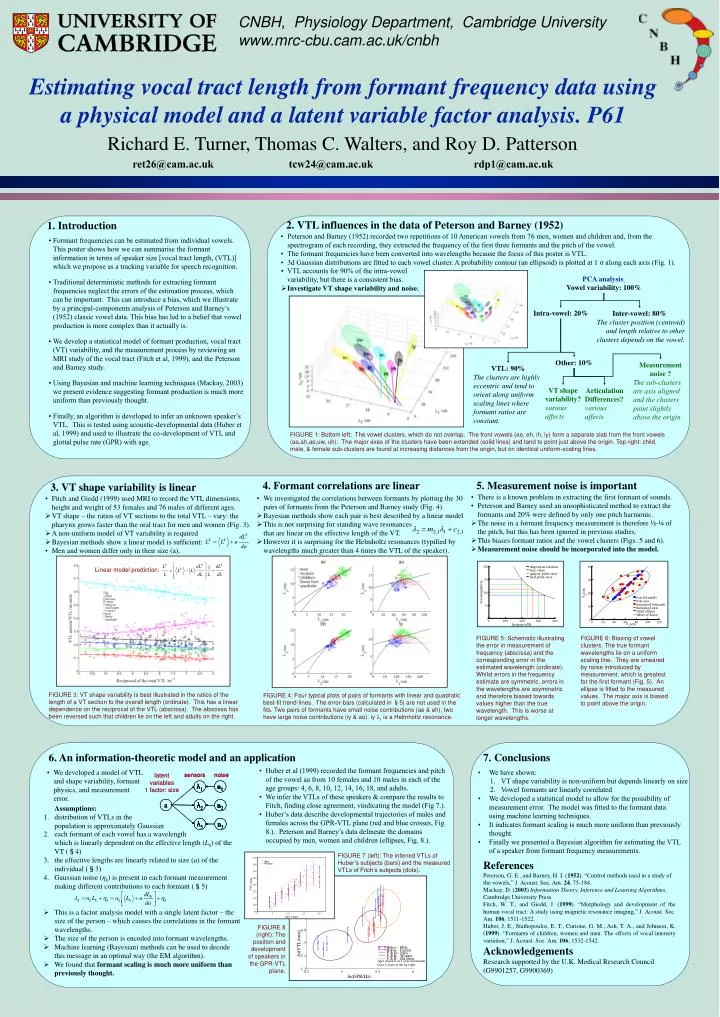
Estimating vocal tract length from formant frequency data using a physical model and a latent variable factor analysis. P61 Richard E. Turner, Thomas C. Walters, and Roy D. Patterson ret26@cam.ac.uktcw24@cam.ac.uk rdp1@cam.ac.uk 2. VTL influences in the data of Peterson and Barney (1952) 1. Introduction • Peterson and Barney (1952) recorded two repetitions of 10 American vowels from 76 men, women and children and, from the spectrogram of each recording, they extracted the frequency of the first three formants and the pitch of the vowel. • The formant frequencies have been converted into wavelengths because the focus of this poster is VTL. • 3d Gaussian distributions are fitted to each vowel cluster. A probability contour (an ellipsoid) is plotted at 1 σalong each axis (Fig. 1). • Formant frequencies can be estimated from individual vowels. This poster shows how we can summarise the formant information in terms of speaker size [vocal tract length, (VTL)] which we propose as a tracking variable for speech recognition. • Traditional deterministic methods for extracting formant frequencies neglect the errors of the estimation process, which can be important. This can introduce a bias, which we illustrate by a principal-components analysis of Peterson and Barney’s (1952) classic vowel data. This bias has led to a belief that vowel production is more complex than it actually is. • We develop a statistical model of formant production, vocal tract (VT) variability, and the measurement process by reviewing an MRI study of the vocal tract (Fitch et al, 1999), and the Peterson and Barney study. • Using Bayesian and machine learning techniques (Mackay, 2003) we present evidence suggesting formant production is much more uniform than previously thought. • Finally, an algorithm is developed to infer an unknown speaker’s VTL. This is tested using acoustic-developmental data (Huber et al, 1999) and used to illustrate the co-development of VTL and glottal pulse rate (GPR) with age. • VTL accounts for 90% of the intra-vowel variability, but there is a consistent bias. • Investigate VT shape variability and noise. PCA analysis Vowel variability: 100% Intra-vowel: 20% Inter-vowel: 80% The cluster position (centroid) and length relative to other clusters depends on the vowel. Other: 10% Measurement noise ? The sub-clusters are axis aligned and the clusters point slightly above the origin VTL: 90% The clusters are highly eccentric and tend to orient along uniform scaling lines where formant ratios are constant. VT shape variability? various affects Articulation Differences? various affects FIGURE 1: Bottom left: The vowel clusters, which do not overlap. The front vowels (ae, eh, ih, iy) form a separate slab from the front vowels (aa,ah,ao,uw, uh). The major axes of the clusters have been extended (solid lines) and tend to point just above the origin. Top right: child, male, & female sub-clusters are found at increasing distances from the origin, but on identical uniform-scaling lines. 4. Formant correlations are linear 5. Measurement noise is important 3. VT shape variability is linear • There is a known problem in extracting the first formant of sounds. • Peterson and Barney used an unsophisticated method to extract the formants and 20% were defined by only one pitch harmonic. • The noise in a formant frequency measurement is therefore ½-¼ of the pitch, but this has been ignored in previous studies. • This biases formant ratios and the vowel clusters (Figs. 5 and 6). • Measurement noise should be incorporated into the model. • We investigated the correlations between formants by plotting the 30 pairs of formants from the Peterson and Barney study (Fig. 4). • Bayesian methods show each pair is best described by a linear model • This is not surprising for standing wave resonances that are linear on the effective length of the VT. • However it is surprising for the Helmholtz resonances (typified by wavelengths much greater than 4 times the VTL of the speaker). • Fitch and Giedd (1999) used MRI to record the VTL dimensions, height and weight of 53 females and 76 males of different ages. • VT shape – the ratios of VT sections to the total VTL – vary: the pharynx grows faster than the oral tract for men and women (Fig. 3). • A non-uniform model of VT variability is required • Bayesian methods show a linear model is sufficient: • Men and women differ only in their size (a). Linear model prediction: FIGURE 5: Schematic illustrating the error in measurement of frequency (abscissa) and the corresponding error in the estimated wavelength (ordinate). Whilst errors in the frequency estimate are symmetric, errors in the wavelengths are asymmetric and therefore biased towards values higher than the true wavelength. This is worse at longer wavelengths. FIGURE 6: Biasing of vowel clusters. The true formant wavelengths lie on a uniform scaling line. They are smeared by noise introduced by measurement, which is greatest for the first formant (Fig. 5). An ellipse is fitted to the measured values. The major axis is biased to point above the origin. FIGURE 3: VT shape variability is best illustrated in the ratios of the length of a VT section to the overall length (ordinate). This has a linear dependence on the reciprocal of the VTL (abscissa). The abscissa has been reversed such that children lie on the left and adults on the right. FIGURE 4: Four typical plots of pairs of formants with linear and quadratic best-fit trend-lines. The error-bars (calculated in §5) are not used in the fits. Two pairs of formants have small noise contributions (ae & eh), two have large noise contributions (iy & ao). iy λ1is a Helmholtz resonance. 6. An information-theoretic model and an application 7. Conclusions • Huber et al (1999) recorded the formant frequencies and pitch of the vowel aa from 10 females and 10 males in each of the age groups: 4, 6, 8, 10, 12, 14, 16, 18, and adults. • We infer the VTLs of these speakers & compare the results to Fitch, finding close agreement, vindicating the model (Fig 7.). • Huber’s data describe developmental trajectories of males and females acrossthe GPR-VTL plane (red and blue crosses, Fig. 8.). Peterson and Barney’s data delineate the domains occupied by men, women and children (ellipses, Fig. 8.). • We developed a model of VTL and shape variability, formant physics, and measurement error. • We have shown: • We developed a statistical model to allow for the possibility of measurement error. The model was fitted to the formant data using machine learning techniques. • It indicates formant scaling is much more uniform than previously thought. • Finally we presented a Bayesian algorithm for estimating the VTL of a speaker from formant frequency measurements. • VT shape variability is non-uniform but depends linearly on size • Vowel formants are linearly correlated • Assumptions: • distribution of VTLs in the • population is approximately Gaussian • each formant of each vowel has a wavelength • which is linearly dependent on the effective length (Lk) of the VT (§4) • the effective lengths are linearly related to size (a) of the individual (§3) • Gaussian noise (ηk) is present in each formant measurement making different contributions to each formant (§5) • This is a factor analysis model with a single latent factor – the size of the person – which causes the correlations in the formant wavelengths. • The size of the person is encoded into formant wavelengths. • Machine learning (Bayesian) methods can be used to decode this message in an optimal way (the EM algorithm). • We found that formant scaling is much more uniform than previously thought. FIGURE 7 (left): The inferred VTLs of Huber’s subjects (bars) and the measured VTLs of Fitch’s subjects (dots). References Peterson, G. E., and Barney, H. I. (1952). “Control methods used in a study of the vowels,” J. Acoust. Soc. Am. 24, 75-184. Mackay, D. (2003)Information Theory, Inference and Learning Algorithms, Cambridge University Press Fitch, W. T., and Giedd, J. (1999). “Morphology and development of the human vocal tract: A study using magnetic resonance imaging,” J. Acoust. Soc. Am. 106, 1511-1522. Huber, J. E., Stathopoulos, E. T., Curione, G. M., Ash, T. A., and Johnson, K. (1999). “Formants of children, women and men: The effects of vocal intensity variation,” J. Acoust. Soc. Am. 106, 1532-1542. FIGURE 8 (right): The position and development of speakers in the GPR-VTL plane. Acknowledgements Research supported by the U.K. Medical Research Council (G9901257, G9900369)