Download
1 / 10
100 likes | 604 Views
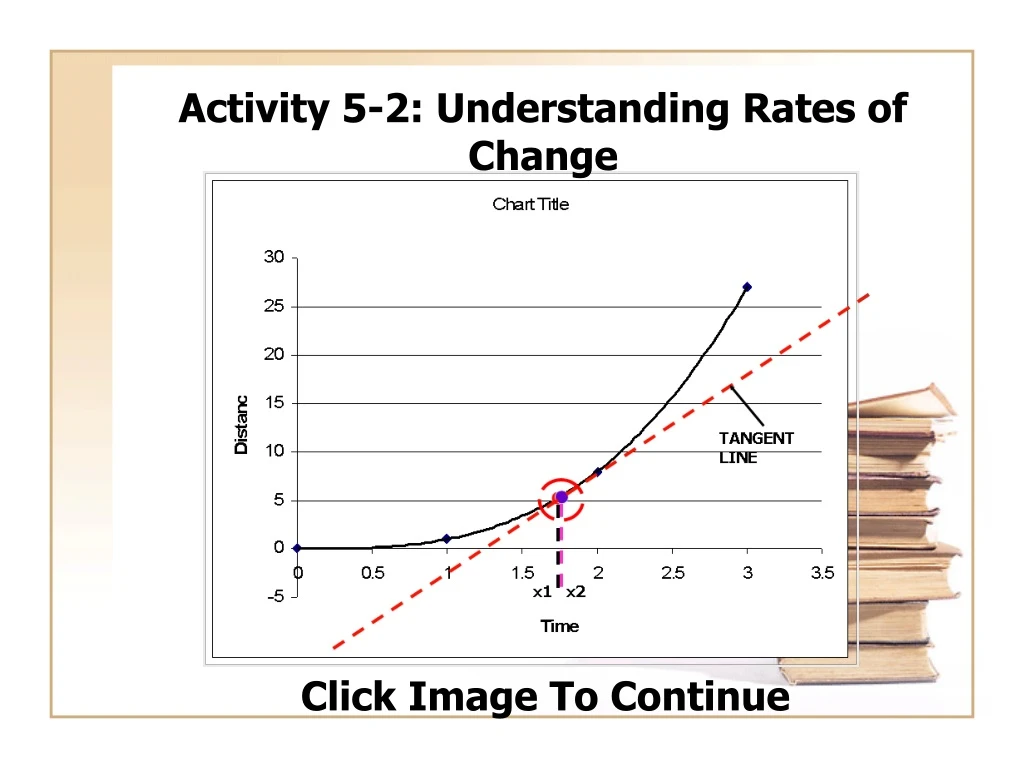
Activity 5-2: Understanding Rates of Change. Click Image To Continue. You stand on a cliff that is 30 metres above Lake Superior. You decide to drop a rock to see how long it takes to hit the water. Due to gravity, the rock height in relation to time follows the function:.

E N D
Activity 5-2: Understanding Rates of Change Click Image To Continue
You stand on a cliff that is 30 metres above Lake Superior. You decide to drop a rock to see how long it takes to hit the water. Due to gravity, the rock height in relation to time follows the function: Activity 5-2: Understanding Rates of Change h(t) = 30 – 4.9t2 What graph best describes this model? • LINEAR • QUADRATIC CORRECT! • EXPONENTIAL • SINUSOIDAL HOME NEXT BACK Technical Note: Make sure the animations follow the same manner as this slide show. Students check off one of the boxes. If they select QUADRATIC, a green CORRECT appears beside the model. If they get it INCORRECT, the word INCORRECT appears beside the word. Students can have as many selections as required to get the correct answer
How long did it take the rock to hit the water to 2 decimal places? Students type their answers in the textbox. If students get the answer 2.47 correct, the CORRECT text appears in green beside the answer. If incorrect, the text INCORRECT in red and the answer is replaced with the correct one. Also, the graph will show the answer too. Follow the slide show animation. The solution under the button will appear after CHECK ANSWER is pressed. The graph of the function is given below: 2.47 CORRECT! CHECK ANSWER Activity 5-2: Understanding Rates of Change Initially, at t=0, the height is 30m h(t) = 30 – 4.9t2 Solution: We can factor h(t) = 30 – 4.9t2 h(t) = -4.9(t2 – 6.122) h(t)=0 when the rock hits water 0= -4.9(t2 – 6.122) .: t2=6.122 or t = 2.474 (only positive) What is the average speed of the rock from the time it was dropped to the time it hits the water? Students type their answers in the textbox. If students get the answer 12.13 or 12.126 or 12.14 or 12.146 or 12.15 correct, the CORRECT text appears in green beside the answer. If incorrect, the text INCORRECT in red and the answer is replaced with the correct one. Also, the graph will show the answer too. Follow the slide show animation. The solution under the button will appear after CHECK ANSWER is pressed. When the rock hits the water at 2.47, the height of the rock is 0 m 12.13 CORRECT! CHECK ANSWER Solution: Speed is the distance travelled in 2.47 seconds s = d/t = 30m/2.47s s = 12.126m/s 2.47 HOME NEXT BACK Technical Note: Make sure the animations follow the same manner as this slide show. The 2.47 text will appear on the graph after students answer the first question and the speed animation after the second question.
The graph of the function is given below: The average speed of the rock is represented by the slope of the line going through the initial point and the final point Activity 5-2: Understanding Rates of Change (0, 30) h(t) = 30 – 4.9t2 Student click the VIEW SLOPE button to SHOW the red dashed line. This line will only appear when the VIEW SLOPE BUTTON is pressed VIEW SLOPE The line joining the two points is called a SECANT. A secant is a line that passes through two points SECANT The average speed is represented by the slope of the secant. Student click the SLOPE OF SECANT button to SHOW the calculation of the slope using slope equation below the button. SLOPE OF SECANT (2.47, 0) HOME NEXT BACK Technical Note: Make sure the animations follow the same manner as this slide show.
The graph of the function is given below: h(t) = 30 – 4.9t2 Find the average speed of the rock between 1 and 2.47 seconds. Activity 5-2: Understanding Rates of Change When student presses the VIEW ANSWER button, the solution below appears in the animation order of this PowerPoint slide show VIEW ANSWER FIND HEIGHT OF ROCK AT t=1 and t=2 We need to determine the height of the rock at 1 and 2.47 seconds using the equation: h(1) = 30 – 4.9(1)2 h(1) = 25.1 m h(2.47) = 0 m (1, 25.1) SECANT FIND THE SPEED USING THE SLOPE OF THE SECANT We can draw the secant between the two points. Using the slope equation we get: (2.47, 0) HOME NEXT BACK Technical Note: Make sure the animations follow the same manner as this slide show.
The graph of the function is given below: h(t) = 30 – 4.9t2 Find the average speed of the rock between 2 and 2.47 seconds. Activity 5-2: Understanding Rates of Change When student presses the VIEW ANSWER button, the solution below appears in the animation order of this PowerPoint slide show VIEW ANSWER FIND HEIGHT OF ROCK AT t=1 and t=2 We need to determine the height of the rock at 2 and 2.47 seconds using the equation: h(2) = 30 – 4.9(1)2 h(2) = 10.4 m h(2.47) = 0 m (2, 25.1) SECANT FIND THE SPEED USING THE SLOPE OF THE SECANT We can draw the secant between the two points. Using the slope equation we get: (2.47, 0) HOME NEXT BACK Technical Note: Make sure the animations follow the same manner as this slide show.
The graph of the function is given below: h(t) = 30 – 4.9t2 Let us view the average speed of the rock from the various times to when it hits ground. Activity 5-2: Understanding Rates of Change When student presses the VIEW SECANTS, the secants display one at a time as shown through the powerpoint animation. VIEW SECANTS -53.4m/s 12.15m/s -17.07m/s Part 1: Review How would you go about estimating the rock’s speed when it hit the water? SHOW ANSWER When student presses the SHOW ANSWER, the text appears below Bring the point closer and closer to t=2.47 seconds. Find the slope of the secant. (2.47, 0) HOME NEXT BACK Technical Note: Make sure the animations follow the same manner as this slide show.
The graph of the function is given below: h(t) = 30 – 4.9t2 Let us view how this occurs Activity 5-2: Understanding Rates of Change When student presses the VIEW SECANTS, the secants display one at a time as shown through the powerpoint animation. VIEW SECANTS How can we find the velocity of the rock the instant it hits the water? Part 1: Review When student presses the VIEW ANSWER, the text shows below VIEW ANSWER Slope of Secant: -23.26 Slope of Secant: -24 Slope of Secant: -25.23 We must find the instantaneous velocity which represents the slope of a point. The slope of a point is called a TANGENT (2.3, 4.08) (2.2, 6.28) (2.4, 1.78) (2.47, 0) HOME NEXT BACK Technical Note: Make sure the animations follow the same manner as this slide show.
The graph of the function is given below: h(t) = 30 – 4.9t2 To approximate the instantaeous speed of the rock we will zoom in the graph. You can press zoom multiple times Activity 5-2: Understanding Rates of Change Notice that function seems looks like a line. Now we have formed a TANGENT! The slope of the tangent represents the instantaneous rate. Slope of Tangent = -24.25 When students press the zoom button, a red dashed box appears where the graph will zoom and a new zoomed graph will appear. Students can press zoom three times and it will zoom three times. ZOOM Slope of Secant=-29.5 Slope of Secant=-26.57 (2.47, 0) (2.45,0.59) (2.4705,0.093) (2.474,0) (2.474,0) HOME NEXT BACK Technical Note: Make sure the animations follow the same manner as this slide show.
Estimate the instantaneous rate of change for each function by reducing the interval over which the average rate of change occurs at x. Students type their answers in the textbox. If students get the answer 2.47 correct, the CORRECT text appears in green beside the answer. If incorrect, the text INCORRECT in red and the answer is replaced with the correct one. Also, the graph will show the answer too. Follow the slide show animation. The solution under the button will appear after CHECK ANSWER is pressed. Activity 5-2: Understanding Rates of Change f(x) = 2x + 3 at x = 3 2 CORRECT! CHECK ANSWER f(x) = 3x at x = 3 31 INCORRECT! 29.7 CHECK ANSWER f(x) = 3sinx at x = 4 -1.96 CORRECT! CHECK ANSWER HOME NEXT BACK Technical Note: Make sure the animations follow the same manner as this slide show. Students type their answers in the textbox. If they are correct, CORRECT appears next to the text box, if they are incorrect, INCORRECT appears beside the textbox with the answer beside the INCORRECT statement as shown above. Allow students an accuracy of 1 decimal place.