Download
1 / 29
290 likes | 382 Views
NBSP Physical Science Leadership Institute. Professor Lynn Cominsky Joanne del Corral Al Janulaw Michelle Curtis Sonoma State University June 27, 2003. Introductions. Lynn Cominsky Joanne del Corral Al Janulaw Michelle Curtis What are your goals for the institute? Pretest.

E N D
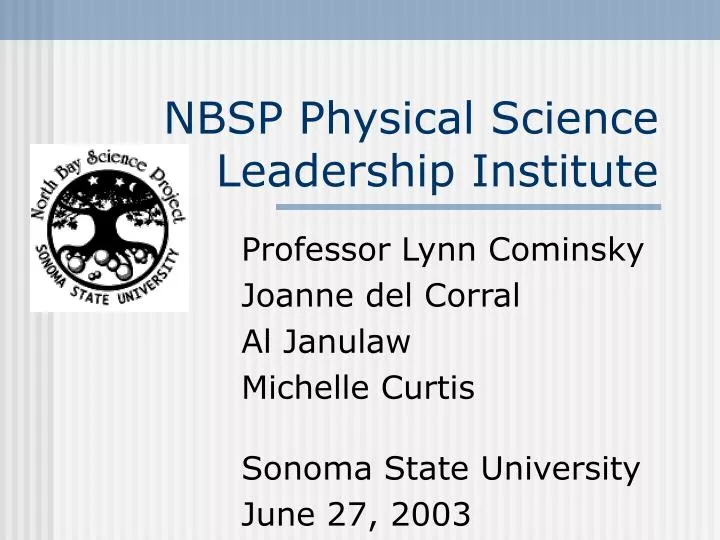
NBSP Physical Science Leadership Institute Professor Lynn Cominsky Joanne del Corral Al Janulaw Michelle Curtis Sonoma State University June 27, 2003
Introductions • Lynn Cominsky • Joanne del Corral • Al Janulaw • Michelle Curtis • What are your goals for the institute? • Pretest Prof. Lynn Cominsky
Scientific Method • Investigation and Experimentation standards exist for all grades • Science progresses by asking questions and performing careful investigations, then analyzing the results to find answers • Beginning skills include describing, measuring, comparing, sorting and orally communicating results Prof. Lynn Cominsky
Scientific Method • Intermediate skills include recording, graphing and analyzing data, and communicating results through written reports • Advanced skills include analyzing uncertainties, prediction of results using a model or theory, designing controlled experiments, using advanced instrumentation and model fitting to experimental results Prof. Lynn Cominsky
Laboratory Notebook • You will use your binder as a laboratory notebook. • All observations, data, and answers to questions must be kept in the notebook. • If you are taking the course for extended ed credit, your notebook will be collected for grading Prof. Lynn Cominsky
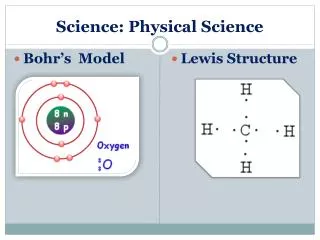
Standard Connections • Students know objects can be described in terms of the materials they are made of and their physical properties, such as color, size, shape, weight, texture, flexibility (K) Prof. Lynn Cominsky
Using Physical Properties to Identify Objects • Given: an apple, ruler, string, balance • Carefully observe the apple. • Write a description of the apple in your notebook. • Use the ruler and string to measure the apple. Record its measurements. Prof. Lynn Cominsky
Using Physical Properties to Identify Objects • Weigh the apple, record the weight. • Now return the apple to the group. • Try to find your apple from the group on the basis of your description and measurements. • Use your balance, ruler and string to repeat the measurements. Compare the measurements to those you took earlier. Prof. Lynn Cominsky
Using Physical Properties to Identify Objects • How did they compare? • Could you find it? • Now return the apple to the group, and pass your description and measurements on to another class member. • Can they use your description and measurements to find your apple? Prof. Lynn Cominsky
Using Physical Properties to Identify Objects • Compare your description to those of the other members of the class • How are they alike? Different? • Create a list of properties by comparing your description to those of your classmates. • Using this list, find a way to classify apples based on their physical properties Prof. Lynn Cominsky
Break – Something to think about • Which is faster, observing or measuring? • Which provides more exact information? • Could you make any predictions about apples that could be tested in another experiment? Prof. Lynn Cominsky
Measuring Uncertainty • You have already made one set of measurements of your apple and repeated the measurements • How did the two measurements of the apple’s weight compare? • What would happen if you used another balance? If someone else did the measurement? Try it. Prof. Lynn Cominsky
Measuring Uncertainty • From comparing the results of the different weight measurements, what do you think is a good estimate of the uncertainty of your measurements? • How well do you think you can read each individual measurement from the balance? Prof. Lynn Cominsky
Measuring Uncertainty • Now consider the measurements of the apple that you made using the ruler and the string • What do you think are possible sources of error in these measurements? • How well did the measurements compare when you repeated them? Prof. Lynn Cominsky
Key Concepts: Uncertainty • There are two types of uncertainty • Systematic – derived from the accuracy of your measuring instrument • Statistical - derived from the spread in a group of measurements • A typical systematic uncertainty is a reading error – usually half of the finest scale that you can read Prof. Lynn Cominsky
Key Concepts: Uncertainty • A typical statistical uncertainty is a standard deviation s • This represents the spread in values around the mean which includes 68% of your measurements, if they are distributed normally Bell curve mean -1s +1s Prof. Lynn Cominsky
Math connections: Uncertainty • Consider a list of test scores in your class • You can add them up and divide by the number of students in your class to find the average (or mean) • You can also plot them in the form of a histogram to see the distribution of scores. • If you have a lot of students, the shape of the distribution should look like a Bell curve • Now look at the list of scores in your binder Prof. Lynn Cominsky
Math connections: Uncertainty • Make a table that shows how many scores are in bins between 0-5, 6-10, 11-15….through 96-100. • Make a plot of the number of scores in each bin, vs. the bin. This is called a histogram. • Now see if you can figure out the range of scores that is within + or – 1s of the mean. This should include about 68% of the scores. What is this range? Prof. Lynn Cominsky
Lunch – Thinking Deeper • If you give the grade of C to the students with the mean test score: • What is the range for a B? • What is the range for a D? • What is the range for an A? • What is the range for an F? • What would be a good way to assign + and – grades? Prof. Lynn Cominsky
Graphing data Activity • A histogram plot is one type of plot that can be used to analyze data • In this activity, we will perform an experiment to measure the circumference of a circular object as a function of its diameter • Given: Many different circular shapes of different sizes, string, ruler Prof. Lynn Cominsky
Standard Connections • Scientific progress is made by asking meaningful questions and conducting carefulinvestigations Draw conclusions from scientific evidence and indicate whether further information is needed to support a specific conclusion. (4 and 5) Prof. Lynn Cominsky
Graphing Activity D • Measure the circumference (using the string and ruler) and diameter of each object • Record your results in a table • Plot a graph of the circumference vs. the diameter • Remember the independent variable goes on the x-axis, and the dependent variable goes on the y-axis Prof. Lynn Cominsky
Graphing Activity • Should the point (0,0) be included on the graph? • Draw a smooth line through the middle of your points. • Compute the slope of the line by choosing 2 points that are far apart on the line that you drew • Slope = (y2 – y1) / (x2-x1) • The slope of this line is a special number for circles. What is it? Prof. Lynn Cominsky
Graphing Activity- thinking deeper • What does this activity tell us about how we can use tables and graphs? Prof. Lynn Cominsky
Break – things to think about • What is the difference between a line graph and a bar graph? • When would you use each type of graph? Prof. Lynn Cominsky
Introduction to Lesson Study • Introductions • James Butler • Millie Anderson • James and Millie are teacher leaders who are going to tell you about Lesson Study, and the work we will be doing throughout the academic year using this process Prof. Lynn Cominsky
Cartesian Diver Activity • Given: one plastic bottle, one glass dropper, water • Fill the bottle with water. • Put enough water into the dropper so it barely floats in water. • Drop the dropper into the bottle and close the bottle lid tightly. • Squeeze the bottle. Prof. Lynn Cominsky
Questions: Cartesian Diver • What do you notice? • How do you explain what happens? • What does a person have to understand conceptually to fully explain how the Cartesian Diver works? http://www.physicslessons.com/cartesian123.gif Prof. Lynn Cominsky
English Language Learning • Throughout this institute, we will be exploring strategies to assist students who are English Language Learners • As a first step, write in your notebook some new words or subjects that you have learned today, and ways that you can remember these concepts. Prof. Lynn Cominsky