Download
1 / 20
440 likes | 905 Views
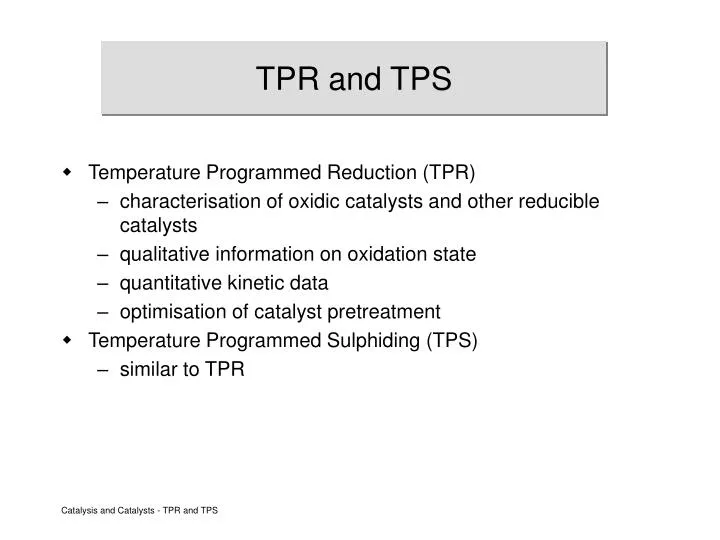
TPR and TPS. Temperature Programmed Reduction (TPR) characterisation of oxidic catalysts and other reducible catalysts qualitative information on oxidation state quantitative kinetic data optimisation of catalyst pretreatment Temperature Programmed Sulphiding (TPS) similar to TPR.

E N D
TPR and TPS • Temperature Programmed Reduction (TPR) • characterisation of oxidic catalysts and other reducible catalysts • qualitative information on oxidation state • quantitative kinetic data • optimisation of catalyst pretreatment • Temperature Programmed Sulphiding (TPS) • similar to TPR Catalysis and Catalysts - TPR and TPS
Examples of TPR Reduction of oxidic species: Study of coke deposits: Reduction of sulphides: MO + H2 M + H2O coke + H2 hydrocarbons + H2O MS + H2 M + H2S Catalysis and Catalysts - TPR and TPS
Thermodynamics G0 (kJ/mol) T (K) Catalysis and Catalysts - TPR and TPS
Equipment for TPR reactor H / Ar 2 molsieve FID TCD Catalysis and Catalysts - TPR and TPS
e d c b a 400 800 1200 400 800 1200 400 800 1200 TPR of 9.1 wt% CoO/Al2O3 j i h g f o n m l k Temperature (K) Temperature (K) Temperature (K) Catalysis and Catalysts - TPR and TPS
TPR Patterns of Reference Materials TCD CoAl2O4 FID Co3O4 CoO 400 800 1200 Temperature (K) Catalysis and Catalysts - TPR and TPS
Influence of ‘hard’ and ‘soft’ Ions CoMoO4 CoAl2O4 Co3O4 400 800 1200 Temperature (K) Catalysis and Catalysts - TPR and TPS
TPS of MoO3/Al2O3 Reactions: MO + H2 M + H2O MO + H2S M + H2O + S MO + H2S MS + H2O M + H2S MS + H2 Catalysis and Catalysts - TPR and TPS
TPS of MoO3/Al2O3 e 100 mg, 4.5 atoms/nm2 200 mg, 2.2 atoms/nm2 400 mg, 1.0 atoms/nm2 800 mg, 0.5 atoms/nm2 400 mg, carrier d c b a 50% H2S conversion Catalysis and Catalysts - TPR and TPS 0 20 40 400 600 800 1000 1200 Time (min) Temperature (K)
TPS of MoO3/Al2O3 100 mg 4.5 atoms/nm2 H2 H2S H2O 400 600 800 1000 1200 Catalysis and Catalysts - TPR and TPS Temperature (K)
O O O S S S S S + H S + H S + H S 2 2 2 M o M o M o M o - H O - H O - H O 2 2 2 O O O O O O O S A l A l A l A l A l A l A l A l I I I I I V I I - S - S - S O S S + H + H S + H S 2 2 2 M o M o M o - H O - H O - H O 2 2 2 O O O O O S A l A l A l A l A l A l V I V I I V Molecular Scheme of Sulphiding Catalysis and Catalysts - TPR and TPS
Modelling of TPR Patterns Catalysis and Catalysts - TPR and TPS
Kinetic Models for Reduction Catalysis and Catalysts - TPR and TPS
TPR of Fe2O3 H2/Ar saturated with 3% H2O 7.0 mg 15.9 mg 8.2 mg 3.6 mg d dry H2/Ar c b a 500 600 700 Temperature (K) Catalysis and Catalysts - TPR and TPS
TPR of Fe2O3 as a Function of Heating Rate 10.0 K/min 0.08 mg f Dry H2/Ar 5.0 K/min 0.19 mg e 2.0 K/min 0.91 mg d 1.0 K/min 1.8 mg c b 0.5 K/min 2.8 mg a 0.2 K/min 3.6 mg 500 600 700 Temperature (K) Catalysis and Catalysts - TPR and TPS
TPR of Fe2O3 as a Function of Heating Rate f 10.0 K/min 0.17 mg Wet H2/Ar (3% H2O) e 5.0 K/min 0.33 mg d 2.0 K/min 0.90 mg 1.0 K/min 1.5 mg c 0.5 K/min 2.6 mg b 0.2 K/min 7.0 mg a 500 600 700 800 Temperature (K) Catalysis and Catalysts - TPR and TPS
(10-4 K-1) Arrhenius Plots from TPR of Fe2O3 (K-1 s-1) c b -15 -16 -17 -18 -19 a dry series main peak Ea = 111 kJ/mol wet series low T peak wet series main peak 12 13 14 15 16 17 18 Catalysis and Catalysts - TPR and TPS
(10-2 K-1) a 4 3 2 1 0 b c d e f 500 550 600 650 Temperature (K) Calculated Fe3O4 Fe TPR Peaks three-dimensional nucleation (Avrami Erofeev); f() = 3(1-) [-ln(1-)]2/3 two-dimensional phase boundary; f() = (1-)1/2 two-dimensional nucleation (Avrami Erofeev); f() = 2(1-) [-ln(1-)]1/2 three-dimensional phase boundary; f() = (1-)2/3 unimolecular decay; f() = (1-) Three-dimensional diffusion (Jander); f() = [3(1-)2/3]/[2(1-(1-)1/3)] Catalysis and Catalysts - TPR and TPS
a b 500 550 600 650 Temperature (K) Comparison of Measured and Calculated Fe3O4 Fe TPR Peaks three-dimensional nucleation (Avrami Erofeev); f() = 3(1-) [-ln(1-)]2/3 calculated Wet series Dry series Catalysis and Catalysts - TPR and TPS