Download
1 / 1
10 likes | 80 Views

E N D
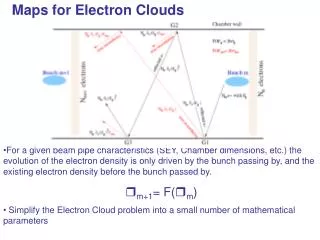
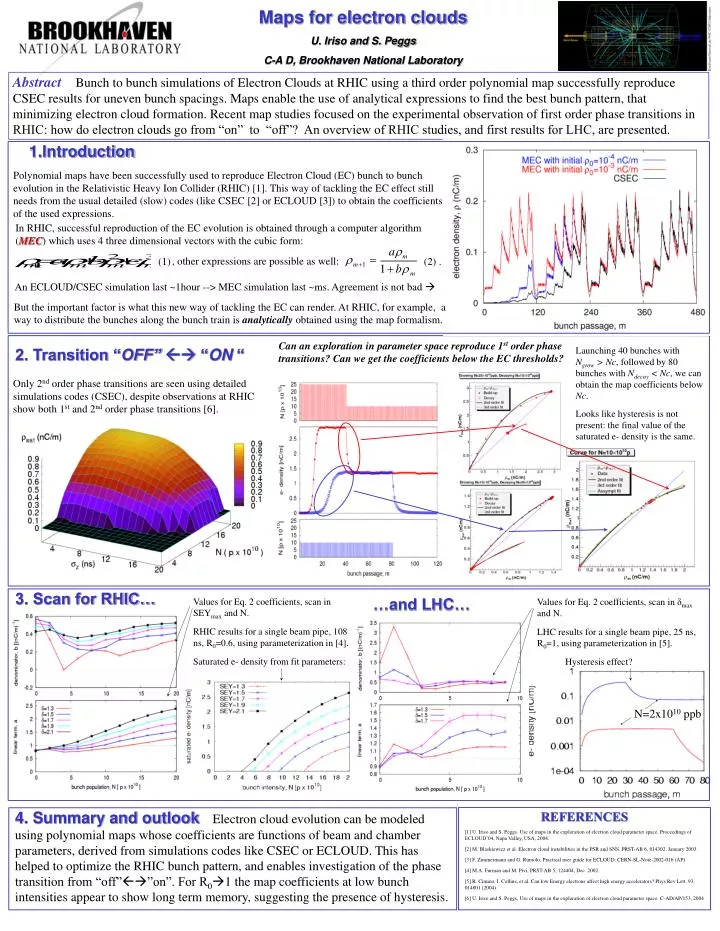
Abstract Bunch to bunch simulations of Electron Clouds at RHIC using a third order polynomial map successfully reproduce CSEC results for uneven bunch spacings. Maps enable the use of analytical expressions to find the best bunch pattern, that minimizing electron cloud formation. Recent map studies focused on the experimental observation of first order phase transitions in RHIC: how do electron clouds go from “on” to “off”? An overview of RHIC studies, and first results for LHC, are presented. 1.Introduction Polynomial maps have been successfully used to reproduce Electron Cloud (EC) bunch to bunch evolution in the Relativistic Heavy Ion Collider (RHIC) [1]. This way of tackling the EC effect still needs from the usual detailed (slow) codes (like CSEC [2] or ECLOUD [3]) to obtain the coefficients of the used expressions. In RHIC, successful reproduction of the EC evolution is obtained through a computer algorithm (MEC) which uses 4 three dimensional vectors with the cubic form: , other expressions are possible as well: (1) (2) . An ECLOUD/CSEC simulation last ~1hour --> MEC simulation last ~ms. Agreement is not bad But the important factor is what this new way of tackling the EC can render. At RHIC, for example, a way to distribute the bunches along the bunch train is analytically obtained using the map formalism. Can an exploration in parameter space reproduce 1st order phase transitions? Can we get the coefficients below the EC thresholds? Launching 40 bunches with Ngrow > Nc, followed by 80 bunches with Ndecay < Nc, we can obtain the map coefficients below Nc. Looks like hysteresis is not present: the final value of the saturated e- density is the same. 2. Transition “OFF” “ON “ Only 2nd order phase transitions are seen using detailed simulations codes (CSEC), despite observations at RHIC show both 1st and 2nd order phase transitions [6]. 3. Scan for RHIC… …and LHC… Values for Eq. 2 coefficients, scan in SEYmax and N. RHIC results for a single beam pipe, 108 ns, R0=0.6, using parameterization in [4]. Saturated e- density from fit parameters: Values for Eq. 2 coefficients, scan in δmax and N. LHC results for a single beam pipe, 25 ns, R0=1, using parameterization in [5]. Hysteresis effect? REFERENCES [1] U. Iriso and S. Peggs. Use of maps in the exploration of electron cloud parameter space. Proceedings of ECLOUD’04, Napa Valley, USA, 2004. [2] M. Blaskiewicz et al. Electron cloud instabilities in the PSR and SNS. PRST-AB 6, 014302. January 2003. [3] F. Zimmermann and G. Rumolo, Practical user guide for ECLOUD. CERN-SL-Note-2002-016 (AP). [4] M.A. Furman and M. Pivi, PRST-AB 5, 124404, Dec. 2002. [5] R. Cimino, I. Collins, et al. Can low Energy electrons affect high energy accelerators? Phys Rev Lett. 93, 014801 (2004). [6] U. Iriso and S. Peggs, Use of maps in the exploration of electron cloud parameter space. C-AD/AP/153, 2004 Maps for electron clouds U. Iriso and S. Peggs C-A D, Brookhaven National Laboratory N=2x10¹⁰ ppb 4. Summary and outlook Electron cloud evolution can be modeled using polynomial maps whose coefficients are functions of beam and chamber parameters, derived from simulations codes like CSEC or ECLOUD. This has helped to optimize the RHIC bunch pattern, and enables investigation of the phase transition from “off””on”. For R01 the map coefficients at low bunch intensities appear to show long term memory, suggesting the presence of hysteresis.