Download
1 / 1
20 likes | 144 Views
Effective Wayfinding in Airports. Providing Information to Airport Operators. A.C. Farr and K.L Mengersen. Discussion. Results. Introduction.

E N D
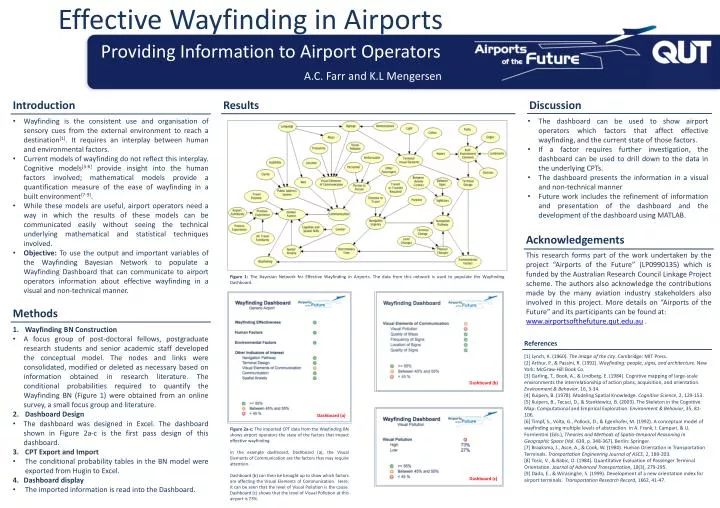
Effective Wayfinding in Airports Providing Information to Airport Operators A.C. Farr and K.L Mengersen Discussion Results Introduction • Wayfinding is the consistent use and organisation of sensory cues from the external environment to reach a destination[1]. It requires an interplay between human and environmental factors. • Current models of wayfinding do not reflect this interplay. Cognitive models[3-6] provide insight into the human factors involved; mathematical models provide a quantification measure of the ease of wayfinding in a built environment[7-9]. • While these models are useful, airport operators need a way in which the results of these models can be communicated easily without seeing the technical underlying mathematical and statistical techniques involved. • Objective: To use the output and important variables of the WayfindingBayesian Network to populate a WayfindingDashboard that can communicate to airport operators information about effective wayfindingin a visual and non-technical manner. • The dashboard can be used to show airport operators which factors that affect effective wayfinding, and the current state of those factors. • If a factor requires further investigation, the dashboard can be used to drill down to the data in the underlying CPTs. • The dashboard presents the information in a visual and non-technical manner • Future work includes the refinement of information and presentation of the dashboard and the development of the dashboard using MATLAB. Methods Figure 1: The Bayesian Network for Effective Wayfinding in Airports. The data from this network is used to populate the Wayfinding Dashboard. References Acknowledgements This research forms part of the work undertaken by the project “Airports of the Future” (LP0990135) which is funded by the Australian Research Council Linkage Project scheme. The authors also acknowledge the contributions made by the many aviation industry stakeholders also involved in this project. More details on “Airports of the Future” and its participants can be found at: www.airportsofthefuture.qut.edu.au. Dashboard (b) • Wayfinding BN Construction • A focus group of post-doctoral fellows, postgraduate research students and senior academic staff developed the conceptual model.The nodes and links were consolidated, modified or deleted as necessary based on information obtained in research literature. The conditional probabilities required to quantify the Wayfinding BN (Figure 1) were obtained from an online survey, a small focus group and literature. • Dashboard Design • The dashboard was designed in Excel. The dashboard shown in Figure 2a-c is the first pass design of this dashboard. • CPT Export and Import • The conditional probability tables in the BN model were exported from Hugin to Excel. • Dashboard display • The imported information is read into the Dashboard. Dashboard (a) Figure 2a-c:The imported CPT data from the Wayfinding BN shows airport operators the state of the factors that impact effective wayfinding. In the example dashboard, Dashboard (a), the Visual Elements of Communication are the factors that may require attention. Dashboard (b) can then be brought up to show which factors are affecting the Visual Elements of Communication. Here, it can be seen that the level of Visual Pollution is the cause. Dashboard (c) shows that the level of Visual Pollution at this airport is 73%. [1] Lynch, K. (1960). The image of the city. Cambridge: MIT Press. [2] Arthur, P., & Passini, R. (1992). Wayfinding: people, signs, and architecture. New York: McGraw-Hill Book Co. [3] Garling, T., Book, A., & Lindberg, E. (1984). Cognitive mapping of large-scale environments the interrelationship of action plans, acquisition, and orientation. Environment & Behavior, 16, 3-34. [4] Kuipers, B. (1978). Modeling Spatial Knowledge. Cognitive Science, 2, 129-153. [5] Kuipers, B., Tecuci, D., & Stankiewicz, B. (2003). The Skeleton in the Cognitive Map: Computational and Empirical Exploration. Environment & Behavior, 35, 81-106. [6] Timpf, S., Volta, G., Pollock, D., & Egenhofer, M. (1992). A conceptual model of wayfinding using multiple levels of abstraction. In A. Frank, I. Campari, & U. Formentini (Eds.), Theories and Methods of Spatio-temporal Reasoning in Geographic Space (Vol. 639, p. 348-367). Berlin: Springer. [7] Braaksma, J., Asce, A., & Cook, W. (1980). Human Orientation in Transportation Terminals. Transportation Engineering Journal of ASCE, 2, 189-203. [8] Tosic, V., & Babic, O. (1984). Quantitative Evaluation of Passenger Terminal Orientation. Journal of Advanced Transportation, 18(3), 279-295. [9] Dada, E., & Wirasinghe, S. (1999). Development of a new orientation index for airport terminals. Transportation Research Record, 1662, 41-47. Dashboard (c)