Download
1 / 21
240 likes | 398 Views
21. BatSound Step by Step. 21. BatSound tool bar - buttons. New file, open file, save file. Record, Play, Stop. Zoom in and Zoom out. Oscillogram, spectrogram, oscillogram/spectrogram, Power spectrum (peak frequency) . 22. How to open a .wav file .

E N D
21 BatSound Step by Step
21 BatSound tool bar - buttons New file, open file, save file Record, Play, Stop Zoom in and Zoom out Oscillogram, spectrogram, oscillogram/spectrogram, Power spectrum (peak frequency)
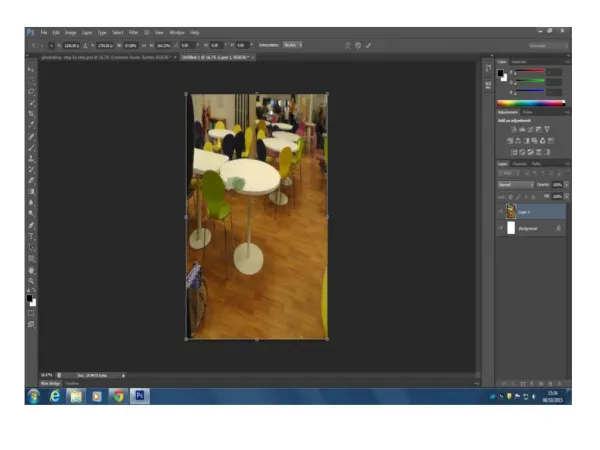
22 How to open a .wav file Right click file, open with, BatSound Application (or Choose Program)
23 Sound menu - Sound format For time expansion this should be set to 10 For some bat detectors you have to remove a zero from the “other box” (44100) when changing this setting For frequency division this should be set to 1
23 Sound menu - Sound format To check if this has been set correct look at the scale on left hand side of the graph Wrong if it the max value is e.g. 20 kHz Correct if it the max value if e.g. 200 kHz Also listen to the recording to make sure that it sounds like the 10 x slowed down call
24 Analysis menu – Default settings Choose Spectrogram settings – Default This will set a default so that it will open all new files in the same format. This will last as long as the BatSound software is not closed.
25 Analysis - Spectrogram settings Right click anywhere in the spectrogram window so that this menu shows. If used via menu you get a different window. Choose Spectrogram Settings – current diagram
26 Min and max frequency/Amplitude colour mapping Min and max frequency. Set to max 100 000 (unless analysing lesser horseshoe bats) Amplitude colour mapping – choose Yellow, Red & Blue (individual preference)
27 FFT size / Amplitude contrast FFT size Try different ones and click apply – choose the clearest view A higher value will give a less grainy view Threshold Choose clearest view If you are still not happy with the quality of view try changing the Amplitude contrast
27 Colour and contrast of the sonogram Good settings give you a smooth yellowbackground with blue parts inside the calls
28 Milliseconds per plot Milliseconds per plot e.g. 4000 This can be set to cover the entire recording or just to give a readable overview Font size – personal preference
29 Measuring calls Choose Measurement cursor rather than Marking cursor Place marker at highest point for fmax (ignore too blurry or weak bits) and do reading of KHz at bottom left hand corner. Do the same for fmin measuring lowest point.
29 Fmax versus Fmin The maximum frequency of the call will be a less reliable value because high frequency sounds do not travel as far as low frequency sound. The minimum frequency is therefore of higher interest. It will not look faded and will be easy to measure.
31 Power spectrum - step by step Natterer's bat calls (two bats) Reference: Volker Runkel and Ulrich Marckmann 2002
32 Marking cursor Select Marking cursor – instead of the Measurement cursor
33 Highlight call Zoom in on the call and highlight the most intense part of the call carefully with the marking cursor
34 Power spectrum Place the marker at highest peak and do KHz reading in bottom left hand corner
34 Which peak to choose? The first peak is low frequency sounds = that is the sound of you walking on gravel
35 Measuring duration For most reliableresult use the oscillogram. Highlight with marker cursor and do reading at bottom left hand corner
35 Duration using oscillogram and sonogram Use the oscillogram to avoid measuring the blurry tail bit that is just an echo part If the call is much longer than 20 ms (Noctule call) you might have this wrong – or it could be a social call.
36 Measuring IPI inter pulse interval Highlight the distance from the start of one call to the start of the next call using the marker cursor and do a reading at bottom left hand corner