Download
1 / 29
290 likes | 383 Views
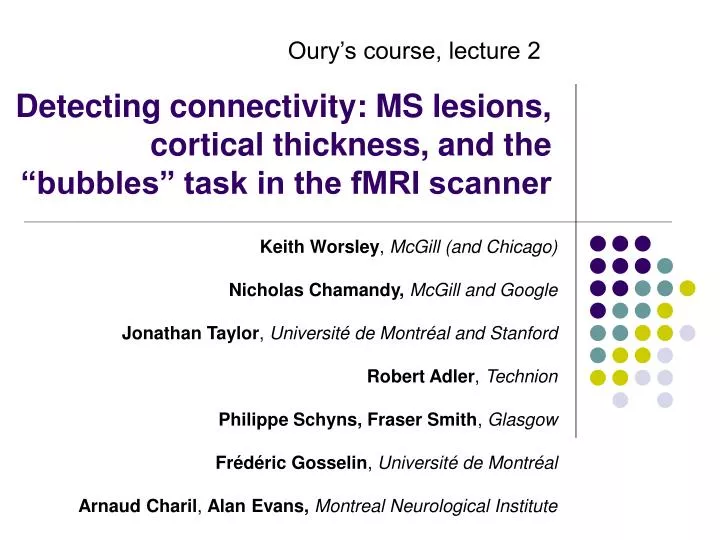
Oury’s course, lecture 2. Detecting connectivity: MS lesions, cortical thickness, and the “bubbles” task in the fMRI scanner. Keith Worsley , McGill (and Chicago) Nicholas Chamandy, McGill and Google Jonathan Taylor , Universit é de Montr é al and Stanford Robert Adler , Technion

E N D
Oury’s course, lecture 2 Detecting connectivity: MS lesions, cortical thickness, and the “bubbles” task in the fMRI scanner Keith Worsley, McGill (and Chicago) Nicholas Chamandy,McGill and Google Jonathan Taylor, Université de Montréal and Stanford Robert Adler, Technion Philippe Schyns, Fraser Smith, Glasgow Frédéric Gosselin, Université de Montréal Arnaud Charil, Alan Evans, Montreal Neurological Institute
Subject is shown one of 40 faces chosen at random … Happy Sad Fearful Neutral
… but face is only revealed through random ‘bubbles’ • First trial: “Sad” expression • Subject is asked the expression: “Neutral” • Response: Incorrect 75 random bubble centres Smoothed by a Gaussian ‘bubble’ What the subject sees Sad
Your turn … • Trial 2 Subject response: “Fearful” CORRECT
Your turn … • Trial 3 Subject response: “Happy” INCORRECT (Fearful)
Your turn … • Trial 4 Subject response: “Happy” CORRECT
Your turn … • Trial 5 Subject response: “Fearful” CORRECT
Your turn … • Trial 6 Subject response: “Sad” CORRECT
Your turn … • Trial 7 Subject response: “Happy” CORRECT
Your turn … • Trial 8 Subject response: “Neutral” CORRECT
Your turn … • Trial 9 Subject response: “Happy” CORRECT
Your turn … • Trial 3000 Subject response: “Happy” INCORRECT (Fearful)
Bubbles analysis • E.g. Fearful (3000/4=750 trials): Trial 1 + 2 + 3 + 4 + 5 + 6 + 7 + … + 750 = Sum Correct trials Thresholded at proportion of correct trials=0.68, scaled to [0,1] Use this as a bubble mask Proportion of correct bubbles =(sum correct bubbles) /(sum all bubbles)
Results • Mask average face • But are these features real or just noise? • Need statistics … Happy Sad Fearful Neutral
Statistical analysis • Correlate bubbles with response (correct = 1, incorrect = 0), separately for each expression • Equivalent to 2-sample Z-statistic for correct vs. incorrect bubbles, e.g. Fearful: • Very similar to the proportion of correct bubbles: Z~N(0,1) statistic Trial 1 2 3 4 5 6 7 … 750 Response 0 1 1 0 1 1 1 … 1
Results • Thresholded at Z=1.64 (P=0.05) • Multiple comparisons correction? • Need random field theory … Z~N(0,1) statistic Average face Happy Sad Fearful Neutral
Results, corrected for search • Random field theory threshold: Z=3.92 (P=0.05) 3.82 3.80 3.81 3.80 • Saddle-point approx (Chamandy, 2007): Z=↑ (P=0.05) • Bonferroni: Z=4.87 (P=0.05) – nothing Z~N(0,1) statistic Average face Happy Sad Fearful Neutral
Scale Separate analysis of the bubbles at each scale
Scale space: smooth Z(s) with range of filter widths w = continuous wavelet transform adds an extra dimension to the random field: Z(s,w) Scale space, no signal 34 8 22.7 6 4 15.2 2 10.2 0 -2 6.8 -60 -40 -20 0 20 40 60 w = FWHM (mm, on log scale) One 15mm signal 34 8 22.7 6 4 15.2 2 10.2 0 -2 6.8 Z(s,w) -60 -40 -20 0 20 40 60 s (mm) 15mm signal is best detected with a 15mm smoothing filter
Matched Filter Theorem (= Gauss-Markov Theorem): “to best detect signal + white noise, filter should match signal” 10mm and 23mm signals 34 8 22.7 6 4 15.2 2 10.2 0 -2 6.8 -60 -40 -20 0 20 40 60 w = FWHM (mm, on log scale) Two 10mm signals 20mm apart 34 8 22.7 6 4 15.2 2 10.2 0 -2 6.8 Z(s,w) -60 -40 -20 0 20 40 60 s (mm) But if the signals are too close together they are detected as a single signal half way between them
Scale space can even separate two signals at the same location! 8mm and 150mm signals at the same location 10 5 0 -60 -40 -20 0 20 40 60 170 20 76 15 34 w = FWHM (mm, on log scale) 10 15.2 5 6.8 Z(s,w) -60 -40 -20 0 20 40 60 s (mm)
Bubbles task in fMRI scanner • Correlate bubbles with BOLD at every voxel: • Calculate Z for each pair (bubble pixel, fMRI voxel) • a 5D “image” of Z statistics … Trial 1 2 3 4 5 6 7 … 3000 fMRI
Thresholding? • Thresholding in advance is vital, since we cannot store all the ~1 billion 5D Z values • Resels = (image resels = 146.2) × (fMRI resels = 1057.2) • for P=0.05, threshold is Z = 6.22 (approx) • Only keep 5D local maxima • Z(pixel, voxel) > Z(pixel, 6 neighbours of voxel) > Z(4 neighbours of pixel, voxel)
Generalised linear models? • The random response is Y=1 (correct) or 0 (incorrect), or Y=fMRI • The regressors are Xj=bubble mask at pixel j, j=1 … 240x380=91200 (!) • Logistic regression or ordinary regression: • logit(E(Y)) or E(Y) = b0+X1b1+…+X91200b91200 • But there are only n=3000 observations (trials) … • Instead, since regressors are independent, fit them one at a time: • logit(E(Y)) or E(Y) = b0+Xjbj • However the regressors (bubbles) are random with a simple known distribution, so turn the problem around and condition on Y: • E(Xj) = c0+Ycj • Equivalent to conditional logistic regression (Cox, 1962) which gives exact inference for b1 conditional on sufficient statistics for b0 • Cox also suggested using saddle-point approximations to improve accuracy of inference … • Interactions? logit(E(Y)) or E(Y)=b0+X1b1+…+X91200b91200+X1X2b1,2+ …
MS lesions and cortical thickness • Idea: MS lesions interrupt neuronal signals, causing thinning in down-stream cortex • Data: n = 425 mild MS patients 5.5 5 4.5 4 Average cortical thickness (mm) 3.5 3 2.5 Correlation = -0.568, T = -14.20 (423 df) 2 1.5 0 10 20 30 40 50 60 70 80 Total lesion volume (cc)
MS lesions and cortical thickness at all pairs of points • Dominated by total lesions and average cortical thickness, so remove these effects as follows: • CT = cortical thickness, smoothed 20mm • ACT = average cortical thickness • LD = lesion density, smoothed 10mm • TLV = total lesion volume • Find partial correlation(LD, CT-ACT) removing TLV via linear model: • CT-ACT ~ 1 + TLV + LD • test for LD • Repeat for all voxels in 3D, nodes in 2D • ~1 billion correlations, so thresholding essential! • Look for high negative correlations … • Threshold: P=0.05, c=0.300, T=6.48
( ) l L t c u s e r D Y ( ) ® l L t c u s e r c  » D k Cluster extent rather than peak height (Friston, 1994) • Choose a lower level, e.g. t=3.11 (P=0.001) • Find clusters i.e. connected components of excursion set • Measure cluster extent by resels • Distribution: • fit a quadratic to the peak: • Distribution of maximum cluster extent: • Bonferroni on N = #clusters ~ E(EC). Z D=1 extent t Peak height s