Download
1 / 1
10 likes | 161 Views
Monthly Evolution of Anomalies. Surface Air Temperature (K). Precipitation (mm/day). 200 mb Height (m). Fig 3a). d). g).

E N D
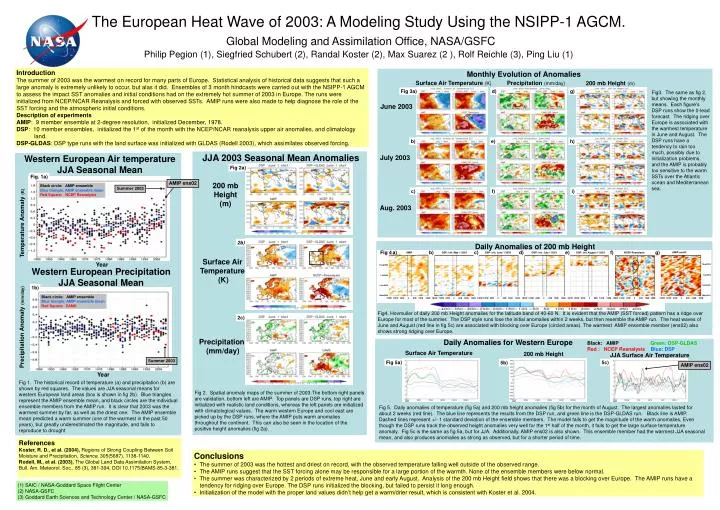
Monthly Evolution of Anomalies Surface Air Temperature (K) Precipitation (mm/day) 200 mb Height (m) Fig 3a) d) g) Fig3. The same as fig 2, but showing the monthly means. Each figure’s DSP runs show the 0-lead forecast. The ridging over Europe is associated with the warmest temperature in June and August. The DSP runs have a tendency to rain too much, possibly due to initialization problems, and the AMIP is probably too sensitive to the warm SSTs over the Atlantic ocean and Mediterranean sea. June 2003 b) e) h) JJA 2003 Seasonal Mean Anomalies Western European Air temperature JJA Seasonal Mean July 2003 Fig 2a) Fig. 1a) AMIP ens02 200 mb Height (m) Black circle: AMIP ensemble Blue triangle: AMIP ensemble mean Red Square: NCEP Reanalysis Summer 2003 c) f) i) Aug. 2003 Temperature Anomaly(K) 2b) Daily Anomalies of 200 mb Height b) c) d) e) f) g) Fig 4 a) AMIP ens02 DSP: init. July 1 2003 DSP: init. August 1 2003 NCEP Reanalysis DSP: init. May 1 2003 AMIP DSP: init. June 1 2003 Surface Air Temperature (K) Year Western European Precipitation JJA Seasonal Mean 1Aug2003 1Aug2003 1Jul2003 1Jul2003 1b) 1Jun2003 1Jun2003 Black circle: AMIP ensemble Blue triangle: AMIP ensemble mean Red Square: CAMS 180W 120W 60W 0 60E 120E180E 180W 120W 60W 0 60E 120E180E 180W 120W 60W 0 60E 120E180E 180W 120W 60W 0 60E 120E180E 180W 120W 60W 0 60E 120E180E 180W 120W 60W 0 60E 120E180E 180W 120W 60W 0 60E 120E180E 1May2003 1May2003 Fig4. Hovmuller of daily 200 mb Height anomalies for the latitude band of 40-60 N. It is evident that the AMIP (SST forced) pattern has a ridge over Europe for most of the summer. The DSP style runs lose the initial anomalies within 2 weeks, but then resemble the AMIP run. The heat waves of June and August (red line in fig 5c) are associated with blocking over Europe (circled areas). The warmest AMIP ensemble member (ens02) also shows strong ridging over Europe. 2c) Precipitation Anomaly(mm/day) Precipitation (mm/day) Daily Anomalies for Western Europe Black: AMIP Green: DSP-GLDAS Red : NCEP Reanalysis Blue: DSP Surface Air Temperature 200 mb Height JJA Surface Air Temperature Summer 2003 Fig 5a) 5c) 5b) Year Fig 1. The historical record of temperature (a) and precipitation (b) are shown by red squares. The values are JJA seasonal means for western European land areas (box is shown in fig 2b). Blue triangles represent the AMIP ensemble mean, and black circles are the individual ensemble members from the AMIP run. It is clear that 2003 was the warmest summer by far, as well as the driest one. The AMIP ensemble mean predicted a warm summer (one of the warmest in the past 50 years), but greatly underestimated the magnitude, and fails to reproduce to drought Fig 2. Spatial anomaly maps of the summer of 2003.The bottom right panels are validation, bottom left are AMIP. Top panels are DSP runs, top right are initialized with realistic land conditions, whereas the left panels are initialized with climatological values. The warm western Europe and cool east are picked up by the DSP runs, where the AMIP puts warm anomalies throughout the continent. This can also be seen in the location of the positive height anomalies (fig 2a). Fig 5. Daily anomalies of temperature (fig 5a) and 200 mb height anomalies (fig 5b) for the month of August. The largest anomalies lasted for about 2 weeks (red line). The blue line represents the results from the DSP run, and green line is the DSP-GLDAS run. Black line is AMIP. Dashed lines represent +/- 1 standard deviation of the ensemble members. The model fails to get the magnitude of the warm anomalies, Even though the DSP runs track the observed height anomalies very well for the 1st half of the month, it fails to get the large surface temperature anomaly. Fig 5c is the same as fig 5a, but for JJA. Additionally, AMIP ens02 is also shown. This ensemble member had the warmest JJA seasonal mean, and also produces anomalies as strong as observed, but for a shorter period of time. Introduction The summer of 2003 was the warmest on record for many parts of Europe. Statistical analysis of historical data suggests that such a large anomaly is extremely unlikely to occur, but alas it did. Ensembles of 3 month hindcasts were carried out with the NSIPP-1 AGCM to assess the impact SST anomalies and initial conditions had on the extremely hot summer of 2003 in Europe. The runs were initialized from NCEP/NCAR Reanalysis and forced with observed SSTs. AMIP runs were also made to help diagnose the role of the SST forcing and the atmospheric initial conditions. Description of experiments AMIP: 9 member ensemble at 2-degree resolution, initialized December, 1978. DSP: 10 member ensembles, initialized the 1st of the month with the NCEP/NCAR reanalysis upper air anomalies, and climatology land. DSP-GLDAS: DSP type runs with the land surface was initialized with GLDAS (Rodell 2003), which assimilates observed forcing. The European Heat Wave of 2003: A Modeling Study Using the NSIPP-1 AGCM.Global Modeling and Assimilation Office, NASA/GSFCPhilip Pegion (1), Siegfried Schubert (2), Randal Koster (2), Max Suarez (2 ), Rolf Reichle (3), Ping Liu (1) AMIP ens02 References Koster, R. D., et al. (2004), Regions of Strong Coupling Between Soil Moisture and Precipitation, Science, 305(5687), 1138-1140. Rodell, M., et al. (2003), The Global Land Data Assimilation System, Bull. Am. Meteorol. Soc., 85 (3), 381-394, DOI 10.1175/BAMS-85-3-381. • Conclusions • The summer of 2003 was the hottest and driest on record, with the observed temperature falling well outside of the observed range. • The AMIP runs suggest that the SST forcing alone may be responsible for a large portion of the warmth. None of the ensemble members were below normal. • The summer was characterized by 2 periods of extreme heat, June and early August. Analysis of the 200 mb Height field shows that there was a blocking over Europe. The AMIP runs have a tendency for ridging over Europe. The DSP runs initialized the blocking, but failed to persist it long enough. • Initialization of the model with the proper land values didn’t help get a warm/drier result, which is consistent with Koster et al. 2004. • SAIC / NASA-Goddard Space Flight Center • NASA-GSFC • Goddard Earth Sciences and Technology Center / NASA-GSFC