Download
1 / 25
250 likes | 416 Views
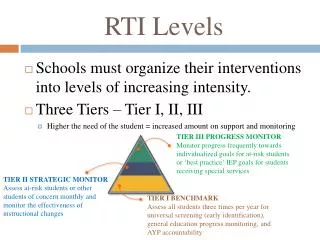
Academic RTI. Research-based, data-driven math interventions on a limited budget. An Ongoing Journey…. Where We Started:. On-Grade Level Proficiency Fall 2008 9th Grade Math: 2 or more grades below 18/95 19% 1 grade below 14/95 15% On Grade Level 19/95 20% 1+ grades above 44/95 46%

E N D
Academic RTI Research-based, data-driven math interventions on a limited budget
Where We Started: On-Grade Level Proficiency • Fall 2008 9th Grade Math: • 2 or more grades below 18/95 19% • 1 grade below 14/95 15% • On Grade Level 19/95 20% • 1+ grades above 44/95 46% • Fall 2008 10th Grade Math: • 2 or more grades below 204/297 69% • 1 grade below 44/297 15% • On or above grade level 49/297 16% • ***As Indicated by Fall 2008 NWEA Data & CSAP Alignment Study • Algebra: 2008 First Quarter F’s = 33% of students failing • 2008 Average ACT Score = 21.7
How do we increase the % of students passing Algebra 1 and better prepare them for future math? • Turn to the person sitting next to you… • What questions do you need to answer in order to effectively address the above question? • What conversations, if any, has your school had surrounding this question?
What we came up with Student Concerns • Why are students failing? • Won’t do or Can’t do? • What are we in control of? Staff Concerns • What can we do to make teaching Algebra more desirable?
Challenges Going Forth: • How to make significant impact without a significant budget • How to correctly identify students before they get here • How to eliminate the “I taught it, they didn’t learn it” attitude
Our First Go: Recovery Math • Students in Algebra 1 are regrouped low, medium, and high based on RIT • Students are assessed in Fall, Winter and Spring. Formative assessments determine grouping. • Students failing mid-semester are given targeted intervention: Recovery Math (double-dose for 6-weeks)
Math Recovery: Algebra I POUDRE HIGH SCHOOL RECOVERY MATH CONTRACT You and your parents/guardians agree that you will attend mandatory recovery Math sessions 5th period, given that your grades are below acceptable levels. Currently you have a ________________ (grade %) in______________________ (class) Therefore, you have the opportunity to enroll in a Double-dose Math Class that you must attend for the remainder of the semester and 2-weeks (minimally) of second semester. This “double-dose” meets period 3 and period 5. At the end of the first semester, if your skills/grades have improved, you will receive an “Incomplete” for the semester, rather than an “F.” Once your instructor agrees that you have demonstrated satisfactory skills in Algebra 1 (First Semester), your grade will be changed from an “I” to a passing grade. By signing this contract, you agree to meet the following requirements; • Attend both periods of Math (period 3 and 5). Unexcused absences will result in the student receiving an “F” for first semester Algebra 1. An “F” in first semester Algebra 1 will require that the student re-take the course in summer school or the following school year. • Complete all assigned work • Treat all staff members with respect. No discipline referrals.
Preparing for the Next Level • Students in recovery class will be re-integrated into Algebra 1 second semester • Low-performing students will be double-dosed 2nd semester to be prepared for Geometry
Sparked Creativity: Refuse to Fail in Integrated II • Learning is the constant, time is the variable • Students given multiple opportunities to demonstrate their understanding • 4 week commitment • Grassroots intervention
Reflections Along the Way • Is a “Won’t do” responsive to double time or do they need to simply demonstrate mastery? • Don’t just say it louder and slower—Need new curriculum and a new way for students to interact with it
What Our Data Showed • 2008 First Quarter F’s: 33% of Algebra 1 Students • 2009 First Quarter F’s: 18% of Algebra 1 Students = 82% Passing! • 15% Increase in School Median Student Growth Percentile • 2008 (49) • 2009 (54)
Targeted Intervention • Won’t Do’s • Use an online program based on mastery—once they show they know it, they’re done! • Can’t Do’s • Screen students based on CSAP, RIT, ELL, IEP, Attendance • Double time • Professional development for staff • Intervention curriculum • Common plan time for Algebra teachers
School Improvement Plan Goals: What you measure you treasure • Close the growth gaps that exist between our sub-groups • How will we accomplish this? • Frequent formative assessments to target skill deficiencies • Use of Navigator modules to target specific skill deficiencies • Intervention options throughout the year for the won’t do and can’t do student—includes Ramp Up and online programs • Job-embedded professional development • Use of Math coach to allow peer observations, data analysis, and facilitation of PLC
Theories of Action: 1. Increase Capacity “If one’s theory of action does not motivate people to put in the effort–individually and collectively–that is necessary to get results, improvement is not possible.” “Capacity building is defined as any strategy that increases the collective effectiveness of a group to raise the bar and close the gap of student learning. For us it involves helping to develop individual and collective knowledge and competencies; resources; and motivation.” Michael Fullan, 2006
2. Learning in Context “…strategies for reform must build in many opportunities for ‘learning in context’. Improvement is more a function of learning to do the right things in the settings where you work” Fullan, 2006. “The problem [is that] there is almost no opportunity for teachers to engage in continuous and sustained learning about their practice in the settings in which they actually work, observing and being observed by their colleagues in their own classrooms and classrooms of other teachers in other schools confronting similar problems” Elmore, 2004. “Shared vision and ownership is more an outcome of a quality process than it is a precondition. This is important to know because it causes one to act differently in order to create ownership” Fullan, 2006.
Administrator’s Role • Take the fear out of change, “ready, fire, aim!” • Relationship first, participate as a learner • Begin with a small group of committed people • Celebrate the small successes to keep momentum going. • Constantly share student data with teachers • Seek continuous improvement and be relentless in doing so!
Comparison of 2011 to 2012 School Performance Frameworks Notice that each subgroup’s median growth percentile increased. With our IEP students it raised from a MGP of 20 to 44!
2011 to 2012 MAP Growth Math We nearly doubled what was projected growth for 9th graders!
MAP Special Programs Math: F/R, SPED, ELL, Minority, Catch-ups Again doubled the growth projection for 9th grade!
ACT College-Readiness Benchmarks Five Year Trends—Average ACT Scores
Compared to PSD Five Year Trends—Average ACT Scores We outperformed the district in 3 subjects AND the composite score! Woo Hoo!
An Ongoing Journey • Professional Development spread to upper levels of Math and across disciplines • Schools in the district are visiting our classes and participating in our PD • Teachers continue to think of creative interventions (ie. Double dose the D’s) • Students’ progress in math is monitored over the years