Download
1 / 23
230 likes | 337 Views
More Dependable Bull Buying with Genomic Enhanced EPDs. Three Trees Ranch November 4, 2012. “Consumer Focus”. “Consumer Genetics”. The Evolution of Livestock Measurement. WITHIN HERD RATIOS. $ VALUES: BIO-ECONOMIC INDEXES. EXPECTED PROGENY DIFFERENCES. AVERAGE DAILY GAIN.

E N D
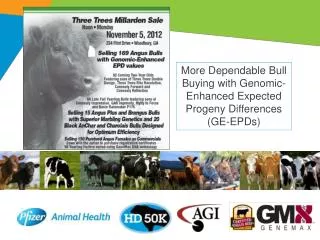
More Dependable Bull Buying with Genomic Enhanced EPDs Three Trees Ranch November 4, 2012
“Consumer Focus” “Consumer Genetics”
The Evolution of Livestock Measurement WITHIN HERD RATIOS $ VALUES: BIO-ECONOMIC INDEXES EXPECTED PROGENY DIFFERENCES AVERAGE DAILY GAIN GENOMIC ENHANCED EPDs and INDEXES
AAA Weekly Genetic Evaluation • 17.3 million pedigrees • 22 million records • 62 million EPDs The data has become currency of today Fiscal 2012
EPDs Pedigree Individual Progeny HD50K Genomic Result
Genomic Results Ultrasound Measures Harvest Data 96,036 carcasses ~41,000 DNA results 1.41 million scans Generate over 2.2 million weekly carcass EPDs American Angus Association Carcass EPDs EPDs are generated for Carcass Weight, Marbling, Ribeye, and Fat
Calving Ease Direct (CED) Bull A +10% Bull B +3% Difference +7% Angus Heifer Calving Ease • Use as a tool in choosing sires mated to first-calf heifers. • Increase the chance of easier calving. • Higher EPDs are more favorable.
Economic Impact • Birth (value of calving ease) • Weaning Direct • Maternal Milk • Mature Cow Size Weaned Calf Index ($W) …
Average annual change (1997 – 2011) BW: -0.05 WW: +1.43 YW: +2.6 MW: +0.8
Feedlot Value ($F) Grid Value ($G) Beef Value ($B) $ per head difference American Angus Association 2005
RADG and Economic Benefits RADG EPD Bull A + .22 Bull B - .09 Difference .31 lb/day • What is .31 lb/day worth? Feedlot performance 160 days on feed x .31 lb/d gain = 49.6 lbs $62.00/head advantage Bull A with no additional feed cost Value of additional weight 49.6 lbs x $125/cwt live price = $62.00/head