Download
1 / 21
210 likes | 325 Views
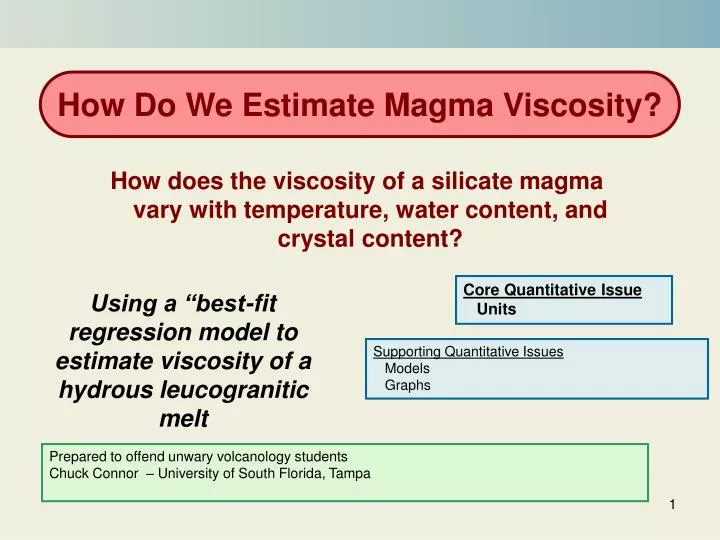
How Do We Estimate Magma Viscosity?. How does the viscosity of a silicate magma vary with temperature, water content, and crystal content?. Core Quantitative Issue Units. Using a “best-fit regression model to estimate viscosity of a hydrous leucogranitic melt .

E N D
How Do We Estimate Magma Viscosity? How does the viscosity of a silicate magma vary with temperature, water content, and crystal content? Core Quantitative Issue Units Using a “best-fit regression model to estimate viscosity of a hydrous leucogranitic melt Supporting Quantitative Issues Models Graphs Prepared to offend unwary volcanology students Chuck Connor – University of South Florida, Tampa
Preview This module presents a calculation of the viscosity of a magma with varying temperature, water content, and crystal content Slides 3-10 give some background on estimates of viscosity in silicate melts and magmas Slide 11 states the problem. What is the density of a hydrous rhyolite magma? Slides 12-14 analyze the problem and prompt you to design a plan to solve it. The problem breaks down into parts: estimating the viscosity of a rhyolite melt using a statistical model, and estimating the change in viscosity as crystals are added to the magma. Slides 15-16 illustrate a spreadsheet that calculates an answer. Slide 17 discusses the point of the module and provides a broader volcanological context Slide 18 consists of some questions that constitute your homework assignment. Slides 19-21 are endnotes for elaboration and reference.
Background What is viscosity? Viscosity is a measure of a fluids resistance to flow. Think of viscosity is as a coefficient that relates the stress applied to a fluid and the fluids response. For example Where t is the stress (Pa) and is the resulting velocity gradient in the fluid, and his the viscosity (sometimes referred to a shear viscosity in this context). Photo by L. Connor This basaltic lava flow emanating from a very small vent on Mt. Etna is about as viscous as a thick salsa.
Background What are the units of viscosity? Consider a fluid trapped between two plates. When a stress is applied to the upper plate, while the lower plate is held still, a vertical velocity gradient is created in the fluid. This velocity gradient is equivalent to a strain rate. Since The units of viscosity are Pascal seconds (Pa s) Figure from Mader, 2006, Volcanic processes as a source of statistical data, In: Mader et al., (eds) Statistics in Volcanology, Geological Society of London, 1-14. Please check for yourself that the units of viscosity must be Pa s, given the equation and diagram
high slope, high viscosity low slope, low viscosity Background Newtonian and non-Newtonian viscosity Any fluid, including silicate melts, is considered Newtonian if there is a linear relationship between stress and strain. That is, if: In a non-Newtonian fluid, the above linear relationship does not hold true. For example, in a Bingham fluid Where to is a yield stress (also called yield strength), required to “get the fluid moving”. Although still linear, a new term is added to the linear equation. Make sure you can sketch the stress-strain relationship for a Bingham fluid on the graph
Background Photo by B. Hill Why estimate the viscosity of magma? Viscosity controls the rate of magma flow in response to a given pressure change and the rate at which gas bubbles and solids (rock fragments and crystals) move through a magma. Low viscosity magmas, such as some basalts, can form very long lava flows very rapidly. In contrast, rhyolite magmas are viscous enough to limit bubble movement. Rather than escaping by buoyantly rising through the magma, gas bubbles are trapped in rhyolite magmas, expand, and eventually create very explosive eruptions. The photo shows a mildly explosive eruption of basaltic magma at Cerro Negro volcano, Nicaragua, in December, 1995. Increasing viscosity due to crystal formation and cooling contribute to explosive activity.
Background What are the viscosities of magmas? Magma viscosity varies with temperature, water content, and composition between about 102 Pa S and about 1011 Pa S. That is nine orders of magnitude! Magma viscosities are often determined experimentally, or measured in the field A platinum sphere (density ~21 g cm-3, melting point about 1768 °C) sinking in NaAlSi3O8 melt at high pressure and high temperature (4.2 GPa and 1700°C). From: K. Funakoshi, A. Suzuki and H. Terasaki, Journal of Physics :Condensed Matter 14, 11343-11347 (2002).
Background Temperature and Viscosity Viscosity is highly dependent on temperature. Think of a pool of molten glass. As the temperature drops, it will take more and more applied stress to make the glass flow. An Arrhenian model of viscosity is one in which viscosity is exponentially dependent on temperature: where ho is viscosity under standard temperature conditions, E is the activation energy, R is the universal gas constant, and T is temperature. This glass is an alkaline silicate melt with low viscosity at 1000 °C and very “workable” into shapes at about 800 to 900 °C. At about 700 °C the viscosity is high enough for the shape to not deform under its own weight. Learn More about the Arrhenian model Learn More about E/RT
Background For most silicate melts, even Arrhenian models do not work! Over the last 25 yr, magma physicists have discovered silicate melts are often non-Arrhenian, largely because of the additional impact of water on viscosity. Water breaks chains of silica polymers in melts and the shorter polymers result in a lower viscosity. One non-Arrhenian model of viscosity is in the form of the Vogel-Fulcher-Tammann (VFT) equation: Where a, b, and c are constants that must be determined for specific melt compositions using lab experiments. Water “de-polymerizes” melts, changing their viscosities
Background For silicate magmas, even non-Arrhenian models do not work! Even when coefficients a, b, and c are estimated for the VFT equation for a specific melt composition, other factors can strongly influence viscosity. Picture the sudden onset of crystallization, a virtual snowstorm of microlites (small feldspar crystals) in an ascending magma. These crystals increase the bulk viscosity of the melt-crystal mixture. Viscosity of the melt-crystal magma mixture can be estimated with: Where f is the volume fraction of crystals and fo is known as the maximum packing fraction of a solid. Microlites in a now frozen magma
Problem Calculate the viscosity of a rhyolite melt with 2 weight percent water at 900 °C and with 0.01 volume fraction crystals Use a form of the VFT model to solve the problem. • More generally, it is useful to use the VFT model to explore the nature of rhyolite magma viscosity. Namely, how does viscosity vary as a function of: • Weight percent water? • Temperature? • Volume fraction crystals in the magma? The volcanic Isla San Luis off the coast of Baja, California, has a Holocene rhyolite dome at its center. The dome is the mass of dark rocks forming a steep mound, indicative of the high viscosity of this magma when it erupted. Photo from the Smithsonian Global Volcanism Network webpage).
Designing a Plan, Part 1 Given the water content, temperature, and volume fraction crystals in the magma, calculate the viscosity Give answer in Pascal seconds (Pa s) • Notes: • Coefficients used in the VFT model remain to be determined at this stage • Different models for calculating magma viscosity from melt viscosity exist; a comparatively simple model based on spherical “crystals” will be implemented here • This VFT model is actually compositionally specific, it is only valid for leucogranitic melts. A leucogranitic melt is a rhyolitic magma enriched in aluminum, often characterized by biotite phenocrysts and a pale colored groundmass. • You will need to: • Implement the VFT model to solve for melt viscosity • calculate the magma viscosity from melt viscosity, given the volume fraction of crystals suspended in the magma
Hess and Digwell (1996) found a best-fit regression model for non-Arrhenian viscosity where h is viscosity, w is weight percent water, T is temperature (°K), and a1, a2, b1, b2, c1,and c2 are coefficients of their regression model. Designing a Plan, Part 2 Calculate the melt viscosity We need to put the VFT model into practice. A form of the VFT model proposed by Hess and Dingwell (1996, Viscosities of hydrous leucogranitic melts: A non-Arrhenian model, American Mineralogist, volume 81, 1297-1300) is used to solve the problem. The values of these coefficients are: a1 = -3.54 a2 = 0.83 b1 = 9601 b2 = -2368 c1 = 196 c2 = 32 Hess and Dingwell estimated the values of the coefficients in the model by regression. That is, they found the best-fit values of these six coefficients using data from 111 viscosity experiments, conducted a various temperatures on rhyolites with various water contents between 0.2 and 12.3 wt% and temperatures between about 750 °K and 1473 °K. Their model is not valid for other conditions! Learn more about regression
Designing a Plan, Part 3 Estimate how the viscosity changes with the addition of crystals to the magma Recall that melt is by definition a liquid, whereas magma contains melt + solids and gas The change in viscosity of a melt with the addition of solid particles, like crystals or xenoliths, is a complex problem. A simplified answer is provided by the following equation. Here the crystals are taken to be spheres (not a particularly good assumption about the shape of many crystals, but a good leading order approximation nevertheless). The viscosity then changes according to a power law. As the crystal spheres become more abundant, they pack closer together until they occupy much of the total volume, with melt only left in the open spaces between spheres. This is the maximum packing fraction of the solid, fo. Assume fo = 0.6 Approaching the maximum packing fraction in a melt populated with “ideally spherical” crystals. Although the “crystals” are densely packed, there is still room for melt in the gaps.
Carrying Out the Plan: Spreadsheet to Calculate the Viscosity A cell containing a number that is given information A cell containing a number that is a constant for this problem At this point be sure to implement this spreadsheet and that your formulas duplicate the values shown. You will need this spreadsheet to complete the end of module assignment A cell containing a formula
A cell containing a number that is given information A cell containing a formula Carrying Out the Plan: Spreadsheet to Calculate the Viscosity While the calculation of a single viscosity value is useful, it does not allow you to see trends. The spreadsheet is easily modified to show results of numerous calculations graphically. Add cells to your spreadsheet so you are able to graph results and observe trends log (viscosity)
What you have done You have calculated the viscosity of a hydrous rhyolite magma using the non-Arrhenian VFT model, and a simplified model to account for volume fraction crystals. The viscosity of silicate melts is fundamental to the nature of magma transport. Viscosity controls the form of lava flows and strongly contributes to he nature of volcanic eruptions. In fact, viscosity is a powerful constraint on the nature of many geological phenomena, such as convective flow in the mantle, the deformation of the ductile lower crust, and particle transport in the atmosphere and in rivers. You have discovered that it is possible to estimate the viscosity of magmas using highly nonlinear models that account for the affects of temperature, water content, and volume fraction of crystals. Although based in physical principles, these models are statistical in nature. That is, the coefficients of the VFT model were estimated from experimental data, using a sophisticated regression technique. It is likely, therefore, that these models will improve with additional experiments. In addition, it is clear that it is inappropriate to use such models outside of the range of experimental data from which they are derived. Useful papers that discuss magma viscosity in detail: Shaw, H.R., 1972, Viscosities of magmatic silicate liquids: An empirical method of prediction. American Journal of Science, 272, 870-889. (Shaw was one of the first people to discuss the relationships between thermodynamic properties of silicates and physical properties of magmas). Hess, K-U., and D.B. Dingwell, 1996, Viscosities of hydrous leucogranitic melts: A non-Arrhenian model, American Mineralogist, 81, 1297-1300. (the VFT method used in this module) Spera, F., 2000, Physical properties of magma, In: Sigurdsson et al., eds., Encyclopedia of Volcanoes, Academic Press, 171-190. (an accessible discussion)
End of Module Assignments • Make sure you turn in a spreadsheet, showing the worked examples. • Plot a graph that shows the dependence of rhyolite magma viscosity on crystal content for hydrous melts (H20 = 2 weight percent, 6 weight percent, and 12 weight percent) at 900 °C. Now consider a magma rising through a volcano conduit. How does water content, crystal content, temperature affect the rate of ascent, all other things being equal? Which factor would you say is most important and why? • Each of the six coefficients (a1-c2) used in the VFT model is estimated. Suppose the error in these estimates is about 20%. That is, the coefficients could be 20% lower or 20% higher than the values reported here. Given this uncertainty, what is the range of viscosities that you estimate for a rhyolite melt that is 4 percent water at 900 °C. • The viscosity of some brands of peanut butter are about 8000 Pa s. Use your spreadsheet to investigate the range of conditions (water content, temperature, crystal content) under which rhyolite magmas would have approximately this viscosity. • What happens to the viscosity of peanut butter when you add whole peanuts to the mixture? Why? • The “obsidian problem’ refers to the fact that some rhyolite magmas reach the surface very quickly, but do not erupt explosively. Rather they form effusive eruptions that make lava domes of very glassy (crystal poor) lava. Use your spreadsheet to investigate this problem. Under what circumstances might rhyolite magmas form such domes rather than erupt in a spectacular explosion?
More about the Arrhenian Model The Arrhenian model is named for Svante Arrhenius, who developed a method of predicting the increased speed of a chemical reaction with increased temperature. His equation has the form: More about E,R,T Where k is the rate coefficient that describes how much faster the reaction will proceed, A is the Arrhenius coefficient, which varies with the specific chemical reaction, E is the activation energy, R the gas constant, and T is temperature. Note that this is the exact form of the Arrhenian viscosity model, with A replaced be the viscosity of the fluid at some standard temperature condition. Arrhenian models are also common in statistics, used to predict the higher rate of failure of just about anything at higher temperatures. For more about the statistical application of the model, see: http://www.itl.nist.gov/div898/handbook/apr/section1/apr151.htm Return to Slide 8
E, R, T E stands for activation energy, literally the energy “hump” or barrier, which must be overcome for a reaction to proceed. In viscosity, the energy that must be applied to get it all flowing. The unit of activation energy is the joule mol-1, that is, the energy required to get one mole of substance to react, or flow. R stands for the universal gas constant and is equal to Boltzmann’s constant x Avagadro’s number. R relates energy to temperature, T. The units of Boltzmann’s constant, found experimentally are joule per °K, k = 1.380 x 10⁻²³ J °K-1, so the universal gas constant is R=8.314 J mol-1°K-1. Prove to yourself that E/RT is dimensionless. What happens to E/RT as T increases but the activation energy remains constant? What happens to the value of exp[-E/RT] as T increases? So in the Arrhenian model, the energy required to make the fluid react (in this case react by flowing) under standard conditions is constant. The viscosity decreases with temperature because the ratio –E/RT decreases with increasing temperature. Remember, this is only a model, because in reality what is happening is that the number and length of silica polymer chains is decreasing with increasing temperature. The model is a symbolic, in this case mathematical, representation of reality. Return to Slide 8
The Nature of Regression In statistics, regression is used to determine the relationship between two or more variables. This relationship is usually characterized by the magnitude of coefficients. For example, in linear regression, y= mx +b, the relationship between variables y and x is determined by the magnitude of the coefficients m and b. Uncertainty exists in any regression model, because the relationship between variables is not ideal. In the plot shown, the relationship between cumulative volume and time looks linear, but there is “certainly uncertainty” (i.e., measured points plot off the line). The best-fit line is a statistical model, that is, a model that includes some component of random (or unexplained) variation. When we use a statistical model to estimate viscosity, we accept the fact that some random variation will not be accounted for by the model! A linear regression showing the relationship between to variables (time, and cumulative eruption volume) for eruptions of Cerro Negro volcano, Nicaragua. Actual values are plotted as solid circles, the line is the best-fit regression. Data from Hill et al., 1998, GSA Bulletin. Return to Slide 13