Download
1 / 43
430 likes | 539 Views
Cost-effectiveness Workshop Two: The Standard Practices Manual Tests. Energy Division June 29 th , 2012. Workshop Agenda. Introduction and Overview 9:00 – 9:45am Consistency across demand-side proceedings 9:45 – 10:30am Break 10:30 – 10:45am

E N D
Cost-effectiveness Workshop Two: The Standard Practices Manual Tests Energy Division June 29th, 2012
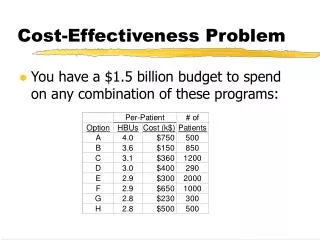
Workshop Agenda • Introduction and Overview 9:00 – 9:45am • Consistency across demand-side proceedings 9:45 – 10:30am • Break 10:30 – 10:45am • The Total Resource Cost Test 10:45am – noon • Lunch noon – 1:00pm • Other SPM tests 1:00 – 2:45pm • Break 2:45 – 3:00pm • Using cost-effectiveness results 3:00 – 3:30pm • Other Issues 3:30 – 4:00pm
Standard Practices Manual (SPM) Workshop Objectives • To provide parties the opportunity to better understand and comment on specific aspects of the Standard Practice Manual tests used to determine cost-effectiveness. • To determine the extent to which the differences between the different types of demand-side programs require differences in the application of the SPM tests. • To provide parties the opportunity to determine whether modifications to the SPM test structure or inputs are necessary to improve cost-effectiveness analysis of demand-side programs.
Summary of Application of the SPM across Demand-side proceedings • The SPM tests were developed to measure the cost-effectiveness of Energy Efficiency programs. • Four tests are used to measure cost-effectiveness from four perspectives: • “Society”: The Total Resource Cost (TRC) test: • Utility: The Program Administrator (PAC) test • Ratepayers: The Ratepayer Impact Measure (RIM) test • Participant: The Participant Test • The SPM also describes a societal cost test (SCT), which is a variation of the TRC that includes “externalities” and uses a social discount rate. The TRC test used in California is actually a hybrid of the TRC and the SCT, in that it includes some externalities.
Cost and Benefits Used Blue text indicates optional, hard-to-quantify benefits. Italic text indicates that values may be different for different tests Green text indicates externalities
Topic 1: Consistency Across Demand-side Proceedings • Discussion objective: Determine which differences are necessary in the cost-effectiveness framework to appropriately address Energy Efficiency, Demand Response, Distributed Generation, Permanent Load Shifting (PLS), and Low Income programs. What are the specific differences in the cost-effectiveness framework that exist among the various proceedings? • Participant Costs • Incentives • Resource Balance Year (discussed yesterday) • Other?
Participant Costs • Energy Efficiency: • Net Incremental Costs x Net-to-Gross Ratio • Net = After rebate • Incremental = Difference between baseline and efficient model • Net-to-Gross ratio = Free-ridership/Total participants • Free-ridership = Costs that would have been incurred even if program did not exist • Demand Response (DR): • Event-based DR: Value of Service Loss + Transaction Costs (75% of incentives used as proxy) • Permanent Load Shifting: Total Cost of Installed System – Rebate • Distributed Generation (DG): • Total Cost of Installed System – Federal Tax Benefits – Rebate
What are incentives? X “Society” = Utilities + Ratepayers $ $ $ $ $ $ $ $ $ $ $ $ $ $ Incentives (transfer payments) Measure costs (equipment costs, including rebates) Society: The Total Resource Cost (TRC) test
Incentives • For Energy Efficiency and Distributed Generation, there are NO incentives (as defined by the SPM). What we generally refer to as incentives are actually rebates for the purchase of equipment. • For Demand Response, incentives are the energy and capacity payments paid to participants for shedding load (reducing demand) during an event. Rebates to DR customers for programmable thermostats and other equipment are considered capital costs.
What relationship should the existing EE, DR, DG, and ESAP cost-effectiveness efforts have to one another? Discussion notes here
Should we continue to separately address cost-effectiveness for EE, DR, DG, ESAP, etc. in different proceedings? • Can consistency only be accomplished if cost-effectiveness is addressed in one proceeding? Discussion notes here
BREAK • Please return at 10:45am
Topic 2: The Total Resource Cost (TRC) Test • In recent year, the CPUC has relied heavily on the TRC to determine whether demand-side programs are cost-effective. Many jurisdictions in the U.S. do the same. • Discussion Objectives: • Determine if modifications are needed to correctly account for any existing costs, benefits, or other inputs. • Determine if there are other costs and benefits which should be included in the TRC test. • Determine if continued reliance on the TRC as the primary test of cost-effectiveness is advisable.
Three proposals for modifying the cost-effectiveness framework EE, DR and DG projects are often undertaken to achieve non-energy benefits (NEBs) as well as energy savings. Critics of the TRC say that we are not correctly accounting for this and we should remedy this by: Replacing the TRC with the PAC (will be discussed later), Adjusting Participants Costs to account for NEBs, or Adding NEBs to the TRC.
Should any of the cost and benefit inputs to the TRC be updated, redefined, or calculated differently? Are we over- or under-estimating some benefits and costs? If so, which ones? • Participant Costs Discussion notes here • Non-energy Benefits (NEBs) Discussion notes here • Other? Discussion notes here
Participant Costs The total TRC costs are those paid by both the utility and the participants.* Thus all equipment costs, installation, operation and maintenance, cost of removal (less salvage value), and administration costs, no matter who pays for them, are included in this test. “Participant costs” refers to the portion of these costs that are incurred by program participants. Some argue that since participants are incurring some of these costs for reasons other than achieving energy savings (i.e., because they want non-energy benefits), the participant costs should reflect only a portion of actual cost incurred (i.e., “equipment costs” are only those costs that are incurred to achieve energy savings). * plus the increase in supply costs for any periods in which load is increased.
Participant Cost Compared Energy Efficiency: Replace on Burnout: Participant Net (after rebate) Incremental Cost x Net-to-Gross Ratio Early Retirement: [Participant Net Incremental Cost + interest costs associated with early retirement] x Net-to-Gross Ratio Direct Install: Participant Co-pay (often zero) Demand Response (DR): Event-based DR: Value of Service Loss + Transaction Costs (75% of incentives used as proxy) Permanent Load Shifting: Total Cost of Installed System – Rebate Distributed Generation (DG): Total Cost of Installed System – Federal Tax Benefits – Rebate
EE Participant Cost Attribution Only costs related to the EE project (either full or incremental) should be included. Product or feature choice not related to EE should be removed (not always obvious or easy to determine). In addition, the “net-to-gross” ratio, which measures “free-ridership,” accounts for influences other than desire to achieve energy savings on participants’ decisions. The net-to-gross ratio is also applied on the benefits side to eliminate the energy savings resulting from free-ridership. The cost of any rebates paid to “free riders” is included in the program costs.
Net to Gross Survey Results: Reasons for Doing the Project * Multiple responses allowed. from Results of Nonresidential Net-to-Gross CATI Survey Pre-Test, Itron, 2011 20
Are we correctly calculating participant costs, especially for programs with large customer costs? • Does the net-to-gross formulation provide an accurate accounting of these costs (for EE)? Should we use a similar process for DR/DG? Discussion notes here 21
Are we correctly calculating participant costs, especially for programs with large customer costs? • Are there other participant costs that are not being captured? (e.g., for DR, participant costs include value of service loss and transaction costs, which are not included in EE or DG) Discussion notes here
Should non-energy benefits (NEBs) be included in the TRC? Participant NEBs accrue to the program participants (such as reduced building operating costs, increased value, comfort, health, and safety). Utility NEBs are realized as indirect costs or savings to the utility (such as bill payment improvements, infrastructure savings, etc.). Societal NEBs represent indirect program effects beyond those realized by ratepayers/utility, and they accrue to society at large (such as job creation, tax receipts growth, labor productivity, housing value, neighborhood stability, and reduced emissions and other environmental benefits).
NEBs Included in the Low Income Tests* Utility: • Reduced arrearage cost • Reduced bad debt written off • Fewer shutoffs • Fewer reconnects • Fewer notices • Fewer customer calls • Fewer emergency gas svc calls • CARE subsidy avoided Participant: • Water/sewer savings • Fewer shutoffs • Fewer calls to utility • Fewer reconnects • Property Value benefits • Fewer fires • Moving costs / mobility • Fewer illnesses and lost days from work/school • Net benefits for comfort & noise • Net benefits for additional hardship *Thanks to Brenda Gettig and Kevin McKinley of Sempra for this slide
Discussion notes here Is the NEBs research that has been done in the low income proceeding on participant and utility NEBs applicable to other resources? If so, which NEBs should be included?
Societal NEBs Job Creation (Do demand side programs create more or higher quality jobs than supply side resources?) Tax receipts growth, labor productivity, housing value, neighborhood stability (Can these be quantified?) Reduced emissions and other environmental benefits (Large body of research – CPUC examining health impacts)
Existing Health Impacts Research at CPUC • Literature review : • Health impacts from criteria pollutants • Cost of health impacts • Account for: • Geography • Air basin • County • Municipality • Rural vs. Urban • Time of generation • Population density • Proximity to source • Air movement • Outside factors 27
Example: CA PM 2.5 from IOU Natural Gas Generation & Mortality 28
How should Societal NEBs fit into the cost-effectiveness framework? Discussion notes here
Are there existing methods to add the avoided costs of embedded energy in water to the TRC? • Method developed for the Water-Energy Pilot? • Others?
Cost Effectiveness of Water Use Reduction Measures Which Result in Savings of Embedded Energy in Water Use A procedure was developed in A.07-01-024 (the Water-Energy Pilot Program) and used to examine estimated TRC and PAC values for the range of measures offered in the IOU pilots. Location: ftp://deeresources.com/pub/Water-Energy/ Calculator: WaterMeasures-AvoidedCostCalcs-v4B.zip Documentation: WaterSavingMeasures-Calculator-v3.pdf Patterned around the EE calculator (to calculate TRC/PAC) with additions related to partnerships with water agencies and using water savings • Uses IOU avoided costs for benefits. • Allocates costs between IOU and water agency benefits. • Uses water agency energy use to convert water savings to energy.
Water Energy Measure Calculator Issues • Currently, only IOU energy saved is considered – are there situations when this limit is not appropriate? • Currently there is limited data on water agency energy use such that often average water agency use has been utilized – is it necessary to utilize more agency/location specific data and is the very high cost of obtaining this data justified? • Should the energy use for intra-marginal (last source used) or extra-marginal (next source to be used) water source be used rather than the current average energy use for existing water agency mix of sources?
What 's the best approach to adding the avoided costs of embedded energy in water to the TRC? Discussion notes here
Topic 3: Other SPM Tests • Discussion Objective: Examine the strengths and weaknesses of the different cost-effectiveness tests
What are the strengths and weaknesses of the various SPM tests, particularly the TRC and the PAC?
What are the pros and cons of using the PAC, rather than the TRC, as the primary test of cost-effectiveness? Discussion notes here
Would additional cost-effectiveness tests, or alterative forms of the existing tests (e.g., a societal TRC) be useful? Discussion notes here
BREAK • Please return at 3:00pm
How should the cost-effectiveness test results be used to determine demand-side program offerings and incentive levels? Discussion notes here
Other Issues Discussion notes here