Download
1 / 7
90 likes | 267 Views
Lecture 10/24/13 6.2 Tests of Significance. Cautions about using. Data must be a SRS from the population. Formula is not correct for other sampling designs. Inference cannot rescue badly produced data. Confidence intervals are not resistant to outliers.

E N D
Cautions about using • Data must be a SRS from the population. • Formula is not correct for other sampling designs. • Inference cannot rescue badly produced data. • Confidence intervals are not resistant to outliers. • If n is small (<15) and the population is not normal, the true confidence level will be different from C. • The standard deviation of the population must be known. The margin of error in a confidence interval covers only random sampling errors!
Interpretation of Confidence Intervals • Conditions under which an inference method is valid are never fully met in practice. Exploratory data analysis and judgment should be used when deciding whether or not to use a statistical procedure. • Any individual confidence interval either will or will not contain the true population mean. It is wrong to say that the probability is 95% that the true mean falls in the confidence interval. • The correct interpretation of a 95% confidence interval is that we are 95% confident that the true mean falls within the interval. The confidence interval was calculated by a method that gives correct results in 95% of all possible samples. In other words, if many such confidence intervals were constructed, 95% of these intervals would contain the true mean.
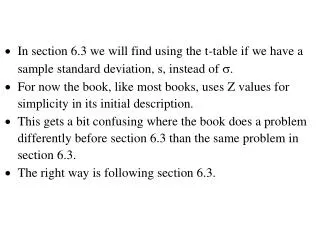
Tests for a population mean To test the hypothesis H0 : µ = µ0 based on an SRS of size n from a Normal population with unknown mean µ and known standard deviation σ, we rely on the properties of the sampling distribution N(µ, σ/√n). The P-value is the area under the sampling distribution for values at least as extreme, in the direction of Ha, as that of our random sample. Again, we first calculate a z-value and then use Table A. Sampling distribution σ/√n µdefined by H0
P-value in one-sided and two-sided tests One-sided (one-tailed) test Two-sided (two-tailed) test To calculate the P-value for a two-sided test, use the symmetry of the normal curve. Find the P-value for a one-sided test and double it.
Steps for Tests of Significance • State the null hypotheses Hoand the alternative hypothesis Ha. • Calculate value of the test statistic. • Determine the P-value for the observed data. • State a conclusion.
Does the packaging machine need revision? H0 : µ = 227 g versus Ha : µ ≠ 227 g What is the probability of drawing a random sample such as yours if H0 is true? Sampling distribution σ/√n = 2.5 g 2.28% 2.28% µ (H0) From table A, the area under the standard normal curve to the left of z is 0.0228. Thus, P-value = 2*0.0228 = 4.56%. The probability of getting a random sample average so different fromµ is so low that we reject H0. The machine does need recalibration.