Download

1 / 32
350 likes | 624 Views
Why medical students should understand statistics . Mike Campbell Professor of Medical Statistics School of Health and Related Research University of Sheffield m.j.campbell@sheffield.ac.uk. ScHARR. Medicine and Society: Phase 1. Medical statistics (P9)

E N D
Why medical students should understand statistics Mike Campbell Professor of Medical Statistics School of Health and Related Research University of Sheffield m.j.campbell@sheffield.ac.uk ScHARR
Medicine and Society: Phase 1 • Medical statistics (P9) • Aim – To take a population approach to effective practice • Academic competence • Introduction (P36) • Ideas about variability
Objectives of lecture • Not to put students off statistics! • Review reasons why medical students should study statistics.
Review of lecture Examples of how the population approach has helped different areas of medicine: • Bristol Royal Infirmary Inquiry • Harold Shipman case • 3rd generation oral contraception scare
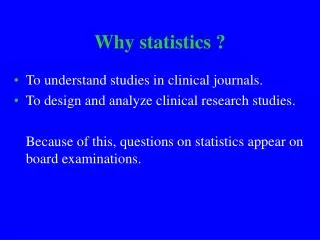
Why should medical students understand statistics? • It will help in other courses • It will help in the interpretation of medical papers • Ultimately, patients will benefit
Why Medical Statistics? • Medicine is a quantitative science but not exact • Not like physics or chemistry • Statistics is about handling and quantifying variation and uncertainty
Variation Variation characterises much of medicine • Humans differ in response to exposure to adverse effects Example: not every smoker dies of lung cancer some non-smokers die of lung cancer • Humans differ in response to treatment Example: penicillin does not cure all infections • Humans differ in disease symptoms Example: Sometimes cough and sometimes wheeze are presenting features for asthma
Probability Thus: Diagnosis and treatment are probabilistically based We talk of the risks due to exposure, the chances of cure, the probability that a patient has a disease
Memorable quotes • 50% of what you learn about therapy in the next 5 years is wrong. (The trouble is we don’t know which 50%) (Anon) • Nothing in life is certain except death and taxes (Woody Allen) • 86% of all statistics are invented on the spot (Huff – How to Lie with Statistics)
Changes to therapy in last 30 years Old therapies discredited • Bed rest after operations • Tourniquets to stop bleeding • Lying new born babies prone • Laetrile for cancer • Bland diets for peptic ulcers • Stretching before vigorous exercise • Arnica for bruising
New therapies in last 10 years • Inhaled anti-inflammatory drugs for asthma • Folate for pregnant mothers • Anti-coagulants before surgery • Knee replacements • Statins for heart disease • MMR vaccine
Clinical Trials • Statisticians have been responsible for the development of the randomised controlled trial by which all new therapies should be evaluated • Therapies should be evidence based
Usefulness of statistics • People in large groups are very predictable • 600,000 people will die next year in UK • At least 1:10 of the medical students will have had asthma as a child • It is likely that someone will win lottery this week • For an ‘average’ person, the chances of dying before the draw are higher than the chance of winning, if the ticket is bought any time up until 20 minutes before the draw.
Usefulness of statistics (2) • Statistics can tell us whether events could have happened by chance • Statistics can tell us the likelihood of rare events • Statistics can tell us what we should ‘expect’
Recent examples from the news Recently a surgeon had a mortality of 60% for a heart operation in children less than one year old. Nationally the mortality rate for this operation in this age group was 16/123 = 13% Would you sack him? No! He may be unlucky. He may be operating on more severe cases He may only have done a few operations. For example 2/3 is 66%.
Surgeon Ctd • In fact no evidence babies were more ill. • The surgeon operated on 15 babies of whom 9 died. • A lower limit for the 95% confidence interval (to be explained later) for this rate is 36%. • An upper limit for the 95% confidence interval for the national rate is 19%. • Would you now sack him? • Yes!
General practice example A certain GP certified 39 deaths in 1995- should we be worried? No! Need to know how many deaths to expect. Solution: look at contemporary records of comparable GPs
GP example 2 Based on data from comparable GPs we would expect 7.4 deaths Can use a Poisson distribution to show that 39 deaths most unlikely to have arisen by chance
P-value • Tells us whether the results could have arisen by chance • Results for men possibly chance (6 in 100) • Results for women only occur 1 in 1000
Result • Clear evidence of systematic murder
Results of Inquiries • Surgeons will be statistically monitored • GPs are likely to be monitored • Both need to be aware of statistical variation
Definitions • Relative Risk (RR) • Ratio of probability of event for exposed person to probability of event for unexposed person (Pe/Pu) • Absolute Risk Reduction (ARR) • Difference in probability of event for exposed person and unexposed person (Pe-Pu)
Contraceptive Pill Scare (October 1995) • Committee on Safety of Medicine issued warning of association between 3rd generation contraceptive pill and deep vein thrombosis • Relative Risk of 2 widely reported • Women advised to discuss risks with GP at time of next prescription • Story leaked to the press before doctors could be properly informed
Contraceptive Pill Scare CSM warning based on the following results: • 30 cases DVT per 100,000 users per year 3rd gen. pill • 15 cases per 100,000 users per year 2nd gen. pill Thus Relative Risk 3rd gen. to 2nd gen. = 2 However: Absolute risk reduction = 15 per 100,000 women per year Thus number needed to get one extra DVT on 3rd gen. = 6700 women years. Note also: • 5 cases per 100,000 per year non-users • 80 cases per 100,000 per year for pregnant women • Mortality from DVT ~ 1-2%
Contraceptive Pill Scare (October 1995) • Advice to consult GP misunderstood • Many women stopped taking the pill immediately or did not finish course • Increase in unwanted pregnancies • Increase in abortion
Conclusions • Due to a misunderstanding of risk, many women came off pill • Many subsequently got pregnant and had an abortion • Risks due to pregnancy and abortion far exceed those due to 3rd generation contraceptive pill
Summary of lecture You should know : Why Medical Statistics is important You should know about: Relative risks, absolute risk reduction
Review of rest of course Later this term Logic behind statistical inference: sampling, confidence intervals and p-values. Diagnostic tests: sensitivity and specificity.
Books Campbell MJ and Machin D (1999) Medical Statistics: A Commonsense Approach. 3rd Ed. Wiley Bland M (2000) An Introduction to Medical Statistics 3rd Ed. Oxford Medical Coggon D(1995) Statistics in Clinical Practice BMJ. Swinscow TDV and Campbell MJ(2002) Statistics at Square One 10th Ed. BMJ http://www.bmj.com/