Download
1 / 24
240 likes | 379 Views
Graph: Relations. There are many kinds of social relations. For example: Role-based : brother of, father of, sister of, etc. : friend of, acquaintance of, enemy of, lover of : teacher of, boss of Affective : likes, loves, hates, admires Cognitive : is familiar with, knows

E N D
Graph: Relations • There are many kinds of social relations. For example: • Role-based : brother of, father of, sister of, etc. : friend of, acquaintance of, enemy of, lover of : teacher of, boss of • Affective : likes, loves, hates, admires • Cognitive : is familiar with, knows • Interactive : has lunch with, sleeps with, talks to, plays games with • : buys from, sells to • Derived : has subscription to the same magazine as, is taller than • : distance between • Flows : moves to, flows to • Mathematically, social networks can be represented as graphs or matrices.
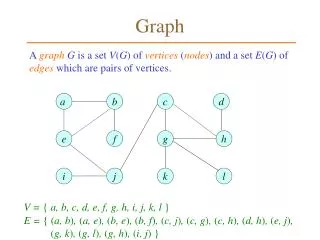
How to draw a Graph? A graph is defined as a set of nodes and a set of lines that connect the nodes. This is sometimes written mathematically as G=(V,E) or G(V,E). Here is one way to draw a graph: Figure 1: Undirected Graph
Graph • It is important to keep in mind that the length of the lines does not usually mean anything. • This is because all it is representing is that there is or is not a relationship. • Similarly, the orientation of the drawing means nothing. • For example, node e could have been placed in the middle of the drawing -- this would not mean anything different. • The only thing that matters is who is connected to whom.
Node Line vertex point actor edge link tie Graph There are many synonyms for the terms "node" and "line":
Graph • The nodes in a graph represent persons (or animals, organizations, cities, countries, etc) • The lines represent relationships among them. • The line between persons a and b is represented mathematically like this: (a,b). • The network shown in previous slide contains these edges: • (a,b), (a,e), (a,d), (b,c), and (d,c).
Different types of Graphs: Undirected graph • There are different kinds of graphs. • For example, there are directed and undirected graphs. • In undirected graphs, the ties have no direction. • For example, in Figure 1, there is a relationship between a and b, and this is the same thing as saying there is a relationship between b and a. • We could refer to the line as (a,b) or (b,a) -- it makes no difference.
Different types of Graphs: Directed graph • In directed graphs (also known as digraphs), the ties do have direction. • In such cases, we typically draw the graph with arrowheads, and refer to the lines as "arcs". • For example, consider Figure 2. • This might record the social relation "who likes whom". • Persons b, d and e all say they like person a. Note that person does not say they like d or e, but they do reciprocate with b. Nobody says they like e.
Different types of Graphs: Directed graph Figure 2: Directed Graph
Different types of Graphs: Valued graph • Graphs can also be valued or non-valued. • A valued graph has numbers attached to the lines that indicate the strength or frequency or intensity or quantity of the tie between nodes. • For example, Figure 3 might record the amount of trade, in trillions of dollars, between some countries:
Different types of Graphs: Valued graph Figure: Valued Graph
Different types of Graphs: Non-valued graph • In non-valued graphs, nodes are either connected or not. • Example: Either Sally and Bill are siblings, or they're not. The relation: The boss of
Different types of Graphs: reflexive & non_reflexive graph • Reflexive graphs allow self-loops. • That is, a node can have a tie to itself. • This is mostly useful when the nodes are collectivities. • For example, if the nodes are cities and the ties represent phone calls between people living in those cities, it is possible (a virtual certainty) that there will be ties from a city to itself.
Multi_graphs • If more than one edge connects two vertices, this is a multigraph. • In general, we do not use multigraphs. • We generally use either valued graphs (to represent the number of interactions between A and B) or wholly separate graphs (to represent substantively different relations, such as "does business with" and "is married to"
Few definitions: • If a line connects two points, they are said to be "adjacent". • The two points connected by a line are called endpoints. • An edge that originates or terminates at a given point is "incident" upon that point. • Two edges that share a point are also said to be incident. • A subgraph of a graph is a subset of its points together with all the lines connecting members of the subset. • The subgraph of Figure 3 that includes the UK, Canada and Algeria has two lines: (UK, Algeria) and (Algeria, Canada).
Few definitions: • The degree of a point is defined as the number of lines incident upon that node. • In Figure 3, the degree of USA is 3 because it has 3 ties. • If a point has degree 0 it is called an isolate. • If it has degree 1 it is called a pendant. • In a directed graph, a point has both indegree and outdegree. • The outdegree is the number of arcs from that point to other points. • In Figure 2, the outdegree of node a is 1. • The indegree is the number of arcs coming in to the point from other points. • The indegree of node a in Figure 2 is 3.
Few definitions: • The density of a graph is defined as the number of ties divided by the number of ties possible. • In a directed graph, the number of ties possible is given by N(N-1), where N is the number of points in the graph. • The density of the graph in Figure 2 is 8/20 which is 0.4 (double headed lines count twice) . • In an undirected graph, the number of ties possible is given by N(N-1)/2, which is just the number of pairs of points. • The density of the graph in Figure 1 is 5/10 which is 0.5.
Few definitions: • A path is an alternating sequence of points and lines, beginning at a point and ending at a point, and which does not visit any point more than once. • Two (or more) paths are point-disjoint (also known as vertex-independent) if they don't share any nodes. • Two paths are edge-disjoint (edge independent) if they don't share any edges. • If they are point-disjoint, then they are definitely edge-disjoint. • But if they are edge disjoint, they might not be point-disjoint.
Few definitions: • A walk is like a path except that there is no restriction on the number of times a point can be visited. • A path is a kind of walk. • A cycle is just like a path except that it starts and ends at the same point. • The length of a path or walk (or cycle) is defined as the number of edges in it • The shortest path between two points is called a geodesic. • It is not always unique (that is, there may be several paths between the same two points that are equally short). • The graph-theoretic distance between two points is defined as the length of the shortest path between them.
Few Definitions • A graph is connected if there exists a path (of any length) from every node to every other node. • The longest possible path between any two points in a connected graph is n-1, where n is the number of nodes in the graph. • A node is reachable from another node if there exists a path of any length from one to the other. • A connected component is a maximal subgraph in which all nodes are reachable from every other. • Maximal means that it is the largest possible subgraph: you could not find another node anywhere in the graph such that it could be added to the subgraph and all the nodes in the subgraph would still be connected.
Few definitions • For directed graphs, there strong components and weak components. • A strong component is a maximal subgraph in which there is a path from every point to every point following all the arcs in the direction they are pointing. • A weak component is a maximal subgraph which would be connected if we ignored the direction of the arcs
Few definitions • A cutpoint is a vertex whose removal from the graph increases the number of components. • That is, it makes some points unreachable from some others. It disconnects the graph. • A cutset is a collection of points whose removal increases the number of components in a graph. • A minimum weight cutset consists of the smallest set of points that must be removed to disconnect a graph. • The number of points in a minimum weight cutset is called the point connectivity of a graph. • If a graph has a cutpoint, the connectivity of the graph is 1. • The minimum number of points separating two nonadjacent points s and t is also the maximum number of point-disjoint paths between s and t
Few definitions • A bridge is an edge whose removal from a graph increases the number of components (disconnects the graph). • An edge cutset is a collection of edges whose removal disconnects a graph. • A local bridge of degree k is an edge whose removal causes the distance between the endpoints of the edge to be at least k. • The edge-connectivity of a graph is the minimum number of lines whose removal would disconnect the graph. • The minimum number of edges separating two nonadjacent points s and t is also the maximum number of edge-disjoint paths between s and t.
And Bil Car Dan Ele Fra Gar Andy 1 0 1 0 0 1 Bill 1 1 0 1 0 0 Carol 1 1 1 1 0 0 Dan 1 1 1 0 0 0 Elena 0 0 0 0 1 0 Frank 0 0 0 0 1 0 Garth 1 1 0 0 0 0 Graph & Matrix : Anything we can represent as a graph, we can also represent as a matrix. For example, if it is a valued graph, then the matrix contains the values instead of 0s and 1s.
Graph & Matrix • If the matrix as a whole is called X, then the contents of any given cell are denoted xij. • For example, in the matrix above, xij = 1, because Andy likes Bill. Note that this matrix is not quite symmetric (xij not always equal to xji). • By convention, we normally record the data so that the row person "does it to" the column person. • For example, if the relation is "gives advice to", then xij = 1 means that person i gives advice to person j, rather than the other way around. • However, if the data is not entered that way and we want it to be so, we can simply transpose the matrix. The transpose of a matrix X is denoted X'. The transpose simply interchanges the rows with the columns.