Download
1 / 22
220 likes | 395 Views
The Impact of Changes in Transportation and Commuting Behaviors During The 1996 Summer Olympic Games in Atlanta on Air quality and Childhood Asthma. Michael Friedman, M.D. Air Pollution and Respiratory Health Branch National Center for Environmental Health

E N D
The Impact of Changes in Transportation and Commuting Behaviors During The 1996 Summer Olympic Games in Atlanta on Air quality and Childhood Asthma Michael Friedman, M.D. Air Pollution and Respiratory Health Branch National Center for Environmental Health Centers for Disease Control and Prevention (CDC) Presented/abridged by Leanne West Georgia Tech Research Institute
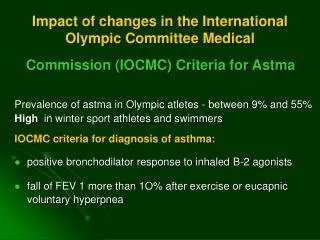
Health Effects of Air Pollution: An Overview of Scientific Evidence to Date • Strong Evidence of Pollution Exposure linked to: • Excess Mortality in elderly (most heart and lung related deaths) • Hospital admissions for heart and lung problems • Asthma exacerbations • Bronchitis symptoms
Health Effects of Air Pollution: The Role of Individual Pollutants • PM10 Elderly and infant mortality, asthma flares hospitalization for heart/lung problems • PM2.5 Elderly mortality, asthma flares, ?? • Ozone (O3) asthma and bronchitis symptoms, CHD?, ?? • Carbon Monoxide (CO) Heart attacks ?, CHD ? • Sulfur Dioxide (SO2) Bronchitis, cough symptoms • Nitrogen Oxides (NOx) Breathing problems, lung function decrease • VOCs (i.e., benzene) childhood leukemia ? • Heavy Metal Oxides ?? • Mixture of Pollutants asthma flares, ??
Link Between Air Quality and Asthma • Epidemiological Time Series Studies: Association between high ozone and/or particulate levels (PM10) and acute asthma exacerbations (or changes in daily asthma symptom scores or PFTs) • Laboratory Studies Using human lung washings/cells or animal models • Experimental Studies Expose volunteers to various concentrations of pollutants and measure lung function changes
Air Quality and Asthma:Unanswered Questions • No study to date had examined the impact of improved city-wide automobile congestion on asthma rates • Need for alternatives to time-series methodology • study cumulative effect over time • measure potential synergy of exposure to multiple pollutants • de-couple pollutant levels and weather change • specifically examine impact of emission-lowering interventions • The 1996 Summer Olympic Games in Atlanta provided such an opportunity
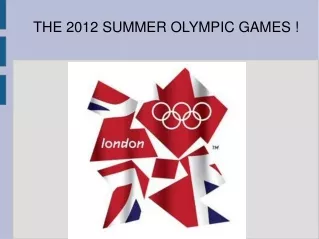
Preparations in Atlanta for The 1996 Summer Olympic Games • “All eyes to be on Atlanta” • 1 million plus visitors …. severe traffic congestion…. problems getting to Olympic venues • Plan developed to alleviate traffic worries
Atlanta’s Plan to Control Automobile Traffic Congestion during the 1996 Summer Olympic Games • Expand and encourage use of public transportation • 24-hour a day bus and rail service • 1000 additional buses for park-and-ride services • free use for Olympic event ticket holders • Promote alternative commuting practices that emphasize shifting travel demand out of the rush hour periods i.e., telecommuting, flextime, staggered work hours, altered delivery and pick-up schedules, carpooling
Atlanta’s Plan to Control Automobile Traffic Congestion during the 1996 Summer Olympic Games • Media warnings of potentially-severe traffic congestion • Highway improvements • road widenings • creation of high-occupancy lanes • Traffic restrictions within Olympic ring/downtown area
Our Basic Study Questions • Did Atlanta’s traffic strategy really work? • What impact did this have on air quality? • What impact did this have on asthma exacerbation rates?
The Olympic Asthma Study: Methods • Ecological study design • comparing the 17 days of the Olympics to the 4 weeks before/after (baseline) • Data Collection: • Acute care visits for asthma* (first ICD9 = 493) • All non-asthma acute care visits* • Levels of individual air pollutants • Meteorological conditions • Vehicular traffic counts • Monthly gasoline sales via statewide gas tax records • Public transportation usage *note: study population included all 1-16 year old residents of the 5 most central counties of Atlanta
Results: Acute Care Visits for Asthma1-16 year old residents of Atlanta Mean Daily Number of Events * p = 0.01
Results: Total Non-Asthma Related Acute Care Visits1-16 year old residents of Atlanta Mean Daily Number of Events
Mean levels of major pollutants before, during, and after the Olympic Games as a percentage of the EPA’s National Ambient Air Quality Standard (NAAQS) for that pollutant1 80 70 60 50 % of EPA Air Quality Standard 40 30 20 10 0 Ozone PM10 CO NO2 SO2 Pre-Olympics (baseline period) Olympic Period Post-Olympics (baseline period) 1NAAQS at time of study: ozone = 120 ppb; particulate matter < 10um (PM10) = 150 ug/m3; carbon monoxide (CO) = 9 ppm; nitrogen dioxide (NO2) = 600 ppb; sulfur dioxide (SO2) = 140 ppb
The relationship between acute asthma events and ozone concentrations averaged over the 3 days preceding the event Average Number of Asthma Visits Per Day * p < 0.01
Results: Morning Rush-hour Traffic Countsdaily average for all roads * p < 0.0001 for all 4 roads
Results: 24-hour Total Traffic Countsdaily average for all 4 roads combined * p < 0.05 for 2 of the 4 roads
Results: Morning Rush Hour and Ozone Formation High Morning Rush Hour Traffic Volumes Stop-and-Go Traffic Jams Build Up of Ozone Precursors in Atmosphere by late morning Rapid Increase in Ozone Formation especially in early afternoon when temperature and sunlight is at maximal intensity Dangerously High Peak Ozone Levels almost always between 12-4 PM
Mean Daytime Meteorological Measures During The Olympics Relative To The Baseline Period
Other Evidence Favoring Traffic Changes as the Cause of Improved Air Quality • Ozone concentrations decreased more in Atlanta than 3 other Georgia sites with similar weather patterns (28% vs. 11%, 17%, 18%) • Carbon Monoxide concentrations decreased 18% during the Olympics • levels much more dependent on automobile emissions than weather • Sulfur Dioxide concentrations increased 22% • consistent with increased use of diesel powered buses and generators • should not have increased if weather conditions favored good air quality • Positive correlation between weekday morning rush hour traffic counts and that day’s peak ozone concentration ( r using roads 1 - 4 = + 0.29, 0.42, 0.34, 0.39 respectively)
Olympic Asthma Study: Conclusions • Measurable short-term changes in transportation and commuting occurred, leading to improved air quality, and fewer asthma exacerbations in Atlanta’s children • Limitations of study: Retrospective nature of the study Lack of critical data No modeling, only correlations • Implications: innovative urban transportation and commuting strategies aimed at decreasing peak hour automobile use and increasing traffic flow may substantially improve the respiratory health of its citizens
The Next Step: Reasking the 3 Basic Study Questions • Can traffic reduction and/or emission reduction strategies work, and if so, how? • What impact will this have on air quality? • What impact will this have on health? i.e., asthma development or exacerbations, death rates among the very young and old, etc.
Acknowledgements • Rafael Balagas Georgia Environmental Protection Division Bill Murphy • Darren Palmer U.S. Environmental Protection Agency • Dennis Tolsma Kaiser-Permanente Deborah Griffin • Gene McDowell Scottish-Rite Medical Center • W. Gerald Teague Egleston Children’s Hospital • Phil Harris Georgia Department of Medical Assistance • Dale Shuirman Georgia Department of Revenue • Chris Porter Cambridge Systematics • The Georgia Department of Transportation • The Atlanta Allergy and Asthma Clinic • Metropolitan Atlanta Rapid Transit Authority (MARTA)