Download
1 / 26
260 likes | 369 Views
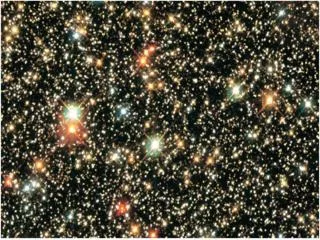
Properties of Elliptical Galaxies – I. Stellar Populations and the Interstellar Medium. Brightest stars are red giants and AGB stars w/ spectral type K, M Very few stars produced in the last 1 – 2 Gyr

E N D
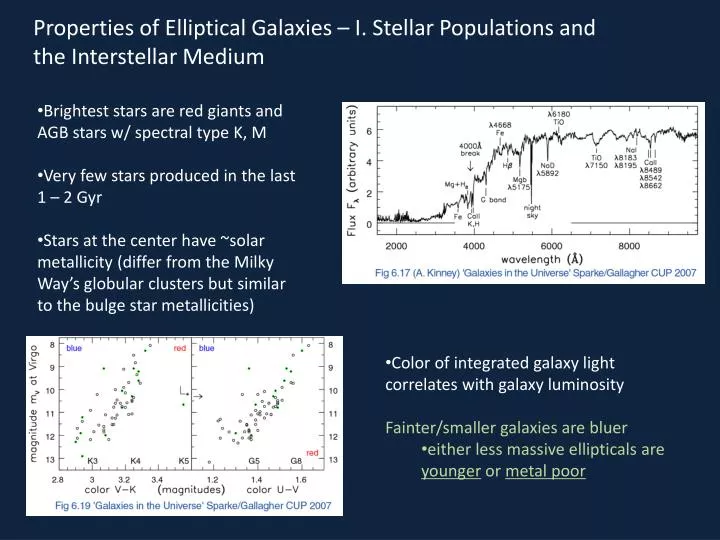
Properties of Elliptical Galaxies – I. Stellar Populations and the Interstellar Medium • Brightest stars are red giants and AGB stars w/ spectral type K, M • Very few stars produced in the last 1 – 2 Gyr • Stars at the center have ~solar metallicity (differ from the Milky Way’s globular clusters but similar to the bulge star metallicities) • Color of integrated galaxy light correlates with galaxy luminosity • Fainter/smaller galaxies are bluer • either less massive ellipticals are younger or metal poor
Galaxies with more recent SF (younger stars) are bluer • Spectra of model galaxies show “bluer” E’s – so called “E+A galaxies” • After 10 Gyr, looks like a typical E • Galaxies that are more metal poor are bluer • Metal absorption lines are strongest in the biggest Ellipticals which are redder • Also, there is a color gradient in Ellipticals • Redder toward the center – more metal rich (based on strength of Mg lines) • Model of galaxy that makes all stars in 108 yr burst • strong emission lines and He absorption (OB stars) seen after 10 Myr • After 100 Myr, deep H lines of A stars are seen (E+A galaxy)
based on strength of Halpha line and H&K break Metallicity measured in Z (solar metallicity units) or [Fe/H] = log(NFe/NH)gal – log(NFe/NH) ~90,000 galaxies from SDSS – luminous galaxies richer in heavy elements but currently have below average star formation rates (SFR). Why are less massive galaxies metal poor? Unable to retain most of the metal-rich gas shed by aging stars
Ellipticals have lots of globular clusters (about twice that of disk galaxies) • these fall into two groups based on color • color determined by metallicity, with more metal-rich GCs (redder) possibly the result of galaxy mergers • Ellipticals have much less cool, atomic gas than spiral galaxies • < 108 – 109 Msun while an Sc galaxy contains ~1010Msun • sometimes (though rare) seen as dust lanes orbiting E’s - from merger or capture? • Ellipticals have hot, ionized gas • stars lose mass through shedding of stellar envelopes as they age • this gas is 1 – 3 x 10⁷ K radiates in X-rays • luminous, most massive E’s have the hottest gas • extends to R > 30 kpc with 109 – 1011 Msun (10 – 20% stellar mass) • smaller E’s have less hot gas – weaker gravity cannot prevent escape • gas not produced through SNe – low metallicity (gas from stars with large random motions kinetic motion heats the gas)
X-ray “surface brightness” is proportional to optical SB in many Ellipticals jopt ~ jx-ray - surprising! Because... jopt ~ n* stellar density jx-ray ~ ne2 plasma density (depends on collisions between e- and ions) And this means that the gas density falls with radius more slowly than stellar density to make SBs so similar. This happens because plasma T is higher than the stellar T if n* ~ r-α ne ~ r-αβ to fit with observations β = T*/T ~ 0.5 (which is about right) Tgas = 7x10⁶ K Tstars (kinetic temp) = 3x10⁶K X-ray – crosses (Chandra) optical – line (HST) normalized at R=10” (Jeltema et al 2003)
Optical, X-ray, and radio luminosities are correlated implies connection between X-ray emitting plasma and radio continuum emission (Binney 1996) X-ray from mass-transfer binaries
Properties of Elliptical Galaxies – II. Kinematics Disordered, random motions are important for Ellipticals v/σ = ordered motion/disordered motion v = systematic velocity change across region of galaxy Vrot or Vr = rotational velocity σ = velocity dispersion of stars at one position or along line-of-sight (los) σ = <v2>1/2 Many E’s have v/σ << 1 Spirals generally have v/σ ≥ 1 cD galaxy NGC 1399 notice (Vr-Vsys)/σ << 1
Measuring Stellar Velocities: • The spectrum measured from some point in an external galaxy consists of the sum of spectra from all unresolved stars along that los. Each star has a different Vlos, so the composite spectrum will be shifted and broadened. • Define los velocity distribution (LOSVD) as the function F(Vlos) such that the fraction of stars with velocities between Vlos and Vlos + dVlos is given by F(Vlos)dVlos mean velocity Vlos = ∫dVlos Vlos F(Vlos) dispersion σ2los = ∫dVlos (Vlos-Vlos)2 F(Vlos) F(Vlos) can be approximated by a Gaussian distribution, but its true form is modeled by closely examining line profile shapes (e.g. Gauss-Hermite model – BM 11.1.2 – more on this later…)
For Elliptical galaxies, σlos is determined by the “width” of the absorption features. Absorption lines are compared with local G & K type stars (templates) to determine dispersion-related broadening. K0 Giant star NGC 2549 S0 galaxy note Mg b absorption feature at 518 nm • G(λ) = F(Vlos) convolved with S(λ) where F(Vlos) is LOSVD
Correlations among global parameters: • 1) σo ∝ color ∝ line strength • higher central velocity dispersion = redder E = stronger metal absorption lines Somewhat non-intuitive because optical color comes mainly from light at Re while Mg strength and σo are based on light primarily from the galaxy center. more massive galaxies are more metal rich (stronger Mg2) The reason: deeper potentials hold ISM longer allowing metals to build up
2) Radius - Surface Brightness Relation Recall I(R) = Ie exp{-7.67[(R/Re)1/4-1]} Then Ltot = ∫o∞ I(R) 2πR dR = 7.22 π Re2 Ie Then, mean surface brightness within Re is: <Ie> = (∫oRe I(R) 2πR dR)/(∫oRe 2πR dR) = (½ Ltot)/π Re2 = (½ (7.22) π Re2 Ie)/(π Re2) = 3.61 Ie = <Ie> easier to measure <Ie> than Ie Observations show… Re ∝ <Ie> -0.83±0.08 Larger galaxies have fainter effective Surface Brightness (Kormendy 1977; Djorgovski & Davis 1987)
Since Le (light interior to Re) = π <Ie> Re2 <Ie> ∝ L -1.5 More luminous Ellipticals have larger Re and fainter mean SB larger and more luminous galaxies are fluffier with lower densities One inference: low-luminosity ellipticals formed with more gaseous dissipation than giant ellipticals. Consistent with Kormendy 09 interpretation for core ellipticals. • σo4∝ Le Faber-Jackson relation (F&J 1976) • More luminous Ellipticals have higher central velocity dispersions • brightest E’s σo ~ 500 km/s • faintest E’s σo ~ 50 km/s • *Can be used as a • distance indicator!!
So, we have correlations between Re and Ie and between σo and Le. Is there a sensible way to combine this information? Before describing the observations, let’s explore what we might expect from dynamics. Virial Theorem: -If Ellipticals are self-gravitating and in dynamical equilibrium, they should obey the Virial Theorem 2KE + PE = 0 Scalar VT VT relates average stellar speeds to the depth of the gravitational potential well in which they move.
Mean velocity squared of all stars in system KE = ½ M <V2> PE = -GM2/Rg Gravitational radius – similar to “effective radius” or half-mass r and depends on detailed mass distribution In VT, we get M<V2> = GM2/Rg M = <V2>Rg/G Expressing VT in terms of mass surface density M/A = η = <V2>Rg/(AG) Assume 1) <V2> ∝ σ 2) Rg∝ Re 3) A ∝ Re2 η ∝ σ2/Re
If an elliptical galaxy obeys VT, then these 3 parameters contain most of the information about its structure. All E’s should obey the same relation if E’s are a homologous family (i.e. E’s have the same SB shape and velocity dispersion distributions). Then E’s should populate a plane in η, σ, R space. Since η is not directly observable, η = M/A = (M/L) <Ie> ∝ (M/L) Ie (M/L) Ie∝ σ2 Re-1
What do observations show? Ellipticals do occupy a plane in 3D space of Ie, σ,Re The Fundamental Plane Observations show… Re∝ σ1.4 Ie-0.85 (Dressler et al. 87) Ie∝ σ1.6 Re-1.2 VT gives (M/L) Ie∝ σ2 Re-1 Both are true if (M/L) ∝ σ0.4 Re0.2 From F-J σ4 ∝Le σ0.4 ∝Le0.1 From R-SB Re0.8∝ Le Re0.2∝ Le0.25 M/L ∝ L0.35 M/L is higher in more luminous, bigger galaxies M/L ∝ L0.27+/-0.08 (Pragniel and Simien 1996)
Therefore, results of parameter correlations in ellipticals can be understood if: • VT is only strong constraint • E’s are a nearly homologous family • M/L ∝ L 0.3 • How do we interpret this M/L relation? • Differences in stellar populations (brighter galaxies are also redder) • Differences in Mdark/Mbaryonic (though Romanowsky 03 show evidence for only small amounts of DM inside Re) • Trujillo et al. 04 argue FP tilt due to a systematic variation of the structural nonhomology of E’s as a function of L • ¾ tilt due to structural nonhomology (more massive galaxies have steeper velocity dispersion profiles (σ1.6 rather than σ2) & SB with higher n) • ¼ tilt due to stellar pops
Core Fundamental Plane (Faber et al. 97) • Rb, Ib and σ obey FP relationship also (where “b” refers to the “break” radius) • VT rules parameters at break radius • Thicker plane central M/L ratios may vary • Dn – σ Correlation (Dressler et al. 87) • Dn = diameter within which mean SB is In = 20.75 μB • This essentially replaces Ie and Re with one parameter • Dn/Re is larger for galaxies of high SB than low SB but with same L • Dn ~ σ1.4 Ie0.07- only weak dependence on Ie • Primarily used as distance indicator (better than L ~ σ because that relation did not also include SB parameter).
Large Scale Kinematics • Kinematic parameters of E’s display overall symmetry about the center of the system (reason to assume equilibrium models explain current state - VT) • Vlos changes sign across galaxy center • Systems display net rotation about minor axis • System flattened by rotation? though same Hubble types can have very different net rotation rates… Observed rotation of E’s is too low to explain observed flattening To quantify this, define Vmax as maximum Vlos Where model values are based on a system whose ellipticity is determined only by rotation (which is ~independent of inclination angle (see BT 4.3)) Thus, (v/σ)* ~ 1 for system flattened by rotation
However, E’s have ratios mostly less than unity • Intermediate-to-low luminosity E’s lie closest to unity • Brightest (and very faintest) have lower values BM Fig 11.7
Velocity distribution profile shapes give a clue… • Recall broadening of E absorption lines is due to random velocities of stars along a given line of sight through the galaxy • G(λ) = F(Vlos) convolved with S(λ) where • F(Vlos) is LOSVD • To first order, we assume the distribution is Gaussian, though deviations (kurtosis, skew) have been observed and show correlations with the amount of rotational velocity. • Use truncated Gauss-Hermite function to model LOSVD where skew is 3rdorder term, kurtosis is 4thorder term
E’s with highest Vrot have most skewed LOSVD indicating 2 components • Non-rotating broad component • Fast rotating narrow component
Embedded disks • Recall “disky” isophotes have larger Vrot than “boxy” isophotes (though photometric modeling is difficult for detecting disks in E’s) • Vlos profiles provide the best evidence for embedded disk components (Rix & White 1990; van der Marel et al. 1994) • Disky E’s have (v/σ)* ~ 1 they are rotationally flattened • If E’s harbor disks, the relative size of this component dictates kinematics along major axis
Dynamical models help to explain non-rotationally flattened systems. • Slow rotation in luminous E’s implies that such objects are flattened by velocity anisotropy rather than rotation. Schwarzchild (1982) showed that: • This argues for triaxial objects – many giant E’s have not relaxed enough to develop an axis of symmetry • equilibrium triaxial systems could exist with slow rotation about the minor axis • Further indication of only partial mixing of stellar orbits – KDC’s
Kinematically Distinct Cores in E’s • 2 kinematic components identified in 25 – 30% of E’s • In most cases, core rotates differently than outer galaxy • Rapid rotation in center, slower further out • Rotation direction different • Central component often rotates around minor axis (Bender et al 1988)
Formation may be due to merger (e.g. NGC 5813) • Core (r < 7”) had distinct SB, Vrot, σ • Core is remnant of dense, low-L E which may have been captured by a larger E • (recall low-L E’s have brighter Ie, higher Vrot, lower σ) Others may be explained by accretion of gas-rich galaxy which settled to center and formed a disk (many KDCs appear to have disk-like profiles. Torques on gas disk by main galaxy cause gas to spin either parallel or anti-parallel. Star formation eventually turns gas into stars. (Efstathiou, Ellis & Carter 1992)