Download
1 / 8
80 likes | 221 Views
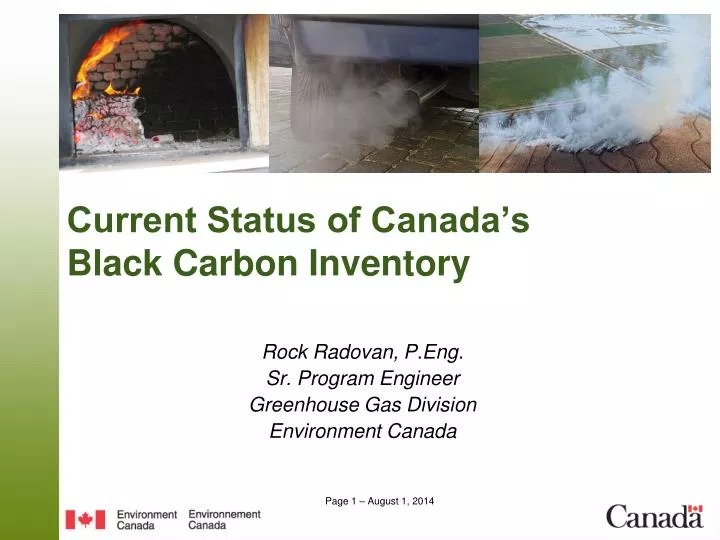
Current Status of Canada’s Black Carbon Inventory. Rock Radovan, P.Eng. Sr. Program Engineer Greenhouse Gas Division Environment Canada. Canada’s BC Inventory. Prepared in 2010 assuming a 2006 base year Developed by staff in Greenhouse Gas Division with support from other groups within EC

E N D
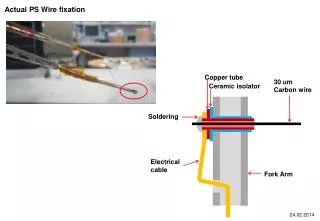
Current Status of Canada’s Black Carbon Inventory Rock Radovan, P.Eng. Sr. Program Engineer Greenhouse Gas Division Environment Canada
Canada’s BC Inventory • Prepared in 2010 assuming a 2006 base year • Developed by staff in Greenhouse Gas Division with support from other groups within EC • Presented as a preliminary estimate • Prepared to support multilateral discussions on Short Lived Climate Forcers (SLCFs) which included Black Carbon • No common or accepted methodology currently in place • Few comparable national inventories • Not prepared as a standalone document as is the case with the National GHG Inventory Report
Canada’s 2006 Black CarbonEmissions - 55.1 kt Emissions from natural sources (e.g. wildfires) are not included in the total. BC emissions from wildfires were estimated to be 20.0 kt for 2006 however this value has a high uncertainty associated with it.
Canada’s BC Inventory Methodology • Builds on existing Criteria Air Contaminant (CAC) and National Pollutant Release Inventory (NPRI) inventories • EC’s atmospheric modelling experts use data from the CAC and NPRI inventories in their research • Allows for consistency across groups, particularly in air quality modelling research • Method similar to approach adopted by US EPA • PM2.5 emissions from inventories are divided into particle components based on source-specific characterization profiles • Use ‘SPECIATE’ database (developed by US) as well as Canadian specific information when available • Generic emission factors also used, mainly for open burning
International Perspective • Government of Canada participating in several multilateral initiatives on SLCFs: • The Arctic Council’s Tromso Declaration (April 2009) established a Task Force on Short-Lived Climate Forcers with a mandate to: • Produce a Technical Report and Summary for Policy Makers on SLCFs, including recommendations for further national and international mitigation actions. (Jan/Feb 2011) • Ad Hoc Expert Group on Black Carbon under the UN Economic Commission for Europe Convention (UNECE) on Long-range Transboundary Air Pollution (LRTAP) • Will provide a report identifying options for potential revisions to the Gothenburg Protocol to mitigate black carbon (due Dec. 2010)
Global & National BC Inventories • Several global emission inventories exist in addition to a number of national level data sets • e.g. the International Institute for Applied Systems Analysis (IIASA)provided a GAINS model of BC/OC emissions for each country party to the UNECE Convention on LRTAP (July 2010) • Disparity between existing inventories, in part due to: • Significant uncertainties in the magnitude of emissions, lack of information on physical distribution of sources, and gaps in knowledge on emissions from specific source categories • Information also lacking for several potentially important sectors such as flaring, shipping, agriculture and forest burning
Geographic distribution ofblack carbon emissions • About 8,000 kt of black carbon emitted globally each year (2004) • Major source contributions for black carbon include approx.: • 40% from coal and oil burned in industrial and mobile sources, • 18% percent from residential biofuels for heating and cooking (wood, agricultural and animal waste), • 42% from open biomass burning - agriculture and forestry and wildfires • Developing countries emit approx. 80% of total BC emissions, while Europe and N. America a combined 13% • Africa emits about 25% of global BC, but nearly all from open burning • China, India and rest of Asia account for est. 39% of global emissions • Europe and North America BC emissions come primarily from fossil fuel combustion and largely above 40°N, therefore contribute disproportionately to warming • BC emissions north of 40°N are most likely to be transported to Arctic regions • Emissions from fossil fuel combustion contribute more to warming due to higher BC to OC ratio.
Geographic distribution of black carbon emissions Adapted from Bond et. al 2004