Download
1 / 37
370 likes | 596 Views
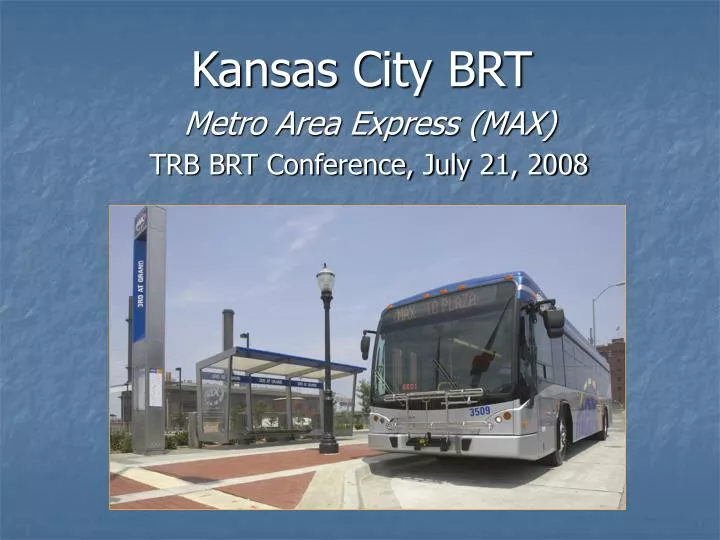
Kansas City BRT Metro Area Express (MAX) TRB BRT Conference, July 21, 2008. Metropolitan Kansas City . Bi-State (Kansas/Missouri) 1.8 Million Population Kansas City Area Transportation Authority (KCATA): Prior to BRT: All Bus Transit System <50,000 Average Weekday Trips.

E N D
Kansas City BRT Metro Area Express (MAX) TRB BRT Conference, July 21, 2008
Metropolitan Kansas City • Bi-State (Kansas/Missouri) • 1.8 Million Population • Kansas City Area Transportation Authority (KCATA): • Prior to BRT: All Bus Transit System • <50,000 Average Weekday Trips
Southtown Corridor River Market Downtown Crown Center MidTown /Main St Country Club Plaza • Regional Employment Center • Civic And Cultural Amenities • Commercial and Retail • Diverse Communities • Slow Transit Service • Declining Transit Ridership • 2004 Average 3,200 Daily Trips
Light Rail Planning 1970’s to 2000 • Multiple AA and MIS Studies 1970’s thru 1990’s • Starter Line Prelim. Engineering 1995 to 1997 -$250M • Central Business Corridor LRT 1999 to 2001 • Failed Sales Tax Vote for LRT August 2001 - $793M • No local business or political support • BRT if LTR not possible • Satisfied Federal AA Requirement for BRT
After years of rail planning Bus Rapid Transit BRT is not rail, BUT IT CAN: • Operate like rail • Provide rapid transit link between Downtown, Crown Center, and Plaza • Be Built and Operate: • At a fraction of the cost of rail • With 80% Federal Funding • NO New Local Taxes ! • In less than 5 years (Actually 3 years) • Gain business and political support !
BRT Development Timeframe • Planning 2002 • Formal Partnerships • City and Parks Dept. 2003 • Main St. Community2003 – Present • Design/Engineering 2003/2004 • Vehicles Ordered 2004 • Construction 2004-2005 • Operational July 2005
Profile of KCATA BRT • Arterial Street Running BRT (6 Miles) • Simple but Substantial Stations w/Enhanced Amenities • Real-Time Information – All Stations • Exclusive Transit Lanes • Signal Priority – 31 Intersections • Identity / Branding – MAX • 9 Minute Peak Hour Headways • Travel Time Reduced by 20%+
Vehicle Objectives • Distinctive BRT Design • Identifiable as BRT from Shape & Graphics • Identifiable as BRT Day and Night • Stylish / High Tech. Look • Incorporate New Technology • Affordable • Maintainable without major facility changes • 2004 Unit Price: $323,000
MAX Vehicles • Fleet of 13 Vehicles • 42’ Low Floor Vehicle • BRT Style • Unique MAX Paint Scheme • Wider Doors & Windows • Improve Knee-Hip Room • 39 Seats • GPS, MDT, TSP • Bike Racks
MAX Street Operations • 7 days a week • 4:30 am to midnight • 9-minute headways am & pm peak • 15 minutes midday, Saturday, events • 30 minutes nights and Sundays • Plaza to Downtown: 18 minutes • Previously 24 minutes • Local bus service paired with MAX in corridor
MAX ‘Bus Only’ Lanes • Street Capacity Available • Peak Hour ‘Bus Only’ Lanes • Full-Time ‘Bus Only’ Lane Downtown • ‘Bus Only’ Lanes 52% of MAX • Meets FTA “Fixed Guideway” Requirement (for New Starts)
ITS Technology ATA MDT & IVLU control and activate on-board emitter • Radio/GPS System (Separately funded) • Traffic Signal Priority (TSP) • Upgraded controllers and interconnect (fiber) • New BRT signal timings • TSP When >1 min. late • No Operator Interaction • Goal: 60% to 70% TSP granted
MAX Station Design Goals • Reposition Transit Image • Clean, Sleek and Modern • Sense of Permanence • Integrate New Technology • Branding/BRT Identity • Standard Elements (Site adapted kit of parts) • Station Prototype
MAX Station and Amenities Landscaping/Public Art at selected locations where ROW available MAX Shelter Trash Receptacle MAX Marker Sidewalk/Streetscape Improvements • Named Stations for Community / Neighborhoods • Attractive, Well-Lighted Station, Unique to MAX • Pedestrian / Sidewalk / Streetscape Improvements • Real-Time Bus Arrival Signage and Announcements
MAX Station Shelter and Marker
MAX Station Shelter and Marker
ITS Technology • Real-Time Arrival Information • All Stations • Traffic Signal Priority • 31 Intersections • Automated Announcements • Audio and Visual (Sign) • On-board and external
MAX Capital Cost • Capital Cost - $21-Million • 80% Federal Funding • 20% Local Funding • Budget Breakdown (In Millions) • $ 2.9 Planning, Design & Engineering • $ 4.3 Vehicles and Inspections • $ 2.3 Street Paving Construction • $ 1.8 Traffic Signal and Signal Priority • $ 8.5 Stop Construction / Installation • $ 0.7 Admin, Easements, Utility & Legal
MAX Bus Rapid Transit • MAX Opened July 2005 • Ridership Up 50%+ • Pre-MAX: 3,200/day • Current: > 6,000/day • High Level of Public Acceptance and Satisfaction
Keys to MAX Success • Early Cooperative Partnerships • City, Community, MainCor • Formal ATA / City Agreement • Early Prototype Station • Avoiding ROW Acquisition • Stations on Far Side of Intersections • Funded with Existing Resources • MAX Branding and Marketing
What would we do differently? • More Buses – Small Fleet Challenges • Fewer Station Compromises • More emphasis on far side stations • More Lane Dedication (More Hours) • No added stations / Maintain spacing • Signal Priority • Negotiate more transit priority • Add intersections • Expanded sidewalk improvements • More emphasis on ride quality and pavement improvements
Expanding MAX FTA Small Starts Program Liberty / KCI. KCI Downtown. North Oak State Ave. Independence Ave. Shawnee Mission Pkway Linwood /Highway 40 Troost Metcalf / College. Main/Wornall - MAX
Troost Corridor Existing Route # 25 Troost Local Bus Service • Local Transit Service Only • 13+ Miles • Daily Transit Ridership 7,500+ • Frequent, Closely Spaced Stops • Very Slow Service in Urban Core
Troost BRT Implementation Schedule • 2006 – Planning / Update AA • Sept. 2006 – Small Starts Funding Submission to FTA • Summer 2007 – Complete PE & Project Development • 2008 / 2009 – Final Design / Construction • Open – Late 2009 / Early 2010
Troost BRT – Very Small Start • Corridor Based Project (10 Miles – Urban Arterial) • Existing Ridership ~ 7,500 • To > 9000 (20% Increase) • Emphasize MAX Brand • < 10 Min. Peak Headways • 20%+ Time Savings
Troost BRT – Very Small Start • Substantial Branded Stations • 44 Stations (2 per Intersection) • 2 Park and Rides + Terminus • Signal Priority @ 34 Intersections • Low Floor BRT Vehicles (14) • Capital Cost < $3 M per Mile
Troost MAX Station Design • Unique to Troost MAX • Recognizable as MAX Brand • Community Input on Station Naming • More Amenities & Waiting Areas • Multi-Directional Weather Protection • More Lighting & Pedestrian Improvements • Incorporate “Green Elements”
Branding MAX on Troost • Maintain MAX • Route Name • Colors • Vehicle Displays • Information Displays
MAX Vehicles-Uniform Fleet with Colored Headsigns- Introduction of Hybrids
Troost MAX Capital Cost • Capital Cost - $30.7-Million • 80% Federal Funding – VERY SMALL START • 20% Local Funding • Budget Breakdown (In Millions) • $ 3.2 Planning, Design & Engineering • $ 5.9 BRT Vehicles (Includes 3 Hybrids) • $ 0.4 Support Facilities (Maintenance) • $ 3.5 Paving, Streetscape, Sidewalk • $ 2.5 Systems (Signals, Signs, TVM) • $12.6 Stations & Park-and-Rides • $ 1.3 Admin, Easements, Utility & Legal