Download
1 / 20
200 likes | 266 Views
Warming-enhanced Plant Growth in the North Since 1980s: A Greener Greenhouse? NASA GSFC Biospheric Sciences Branch 1 Department of Geography, Boston University 2 1 Compton J. Tucker and Daniel Slayback 2 Liming Zhou, Robert K. Kaufmann, and Ranga B. Myneni. Changes in Climate.

E N D
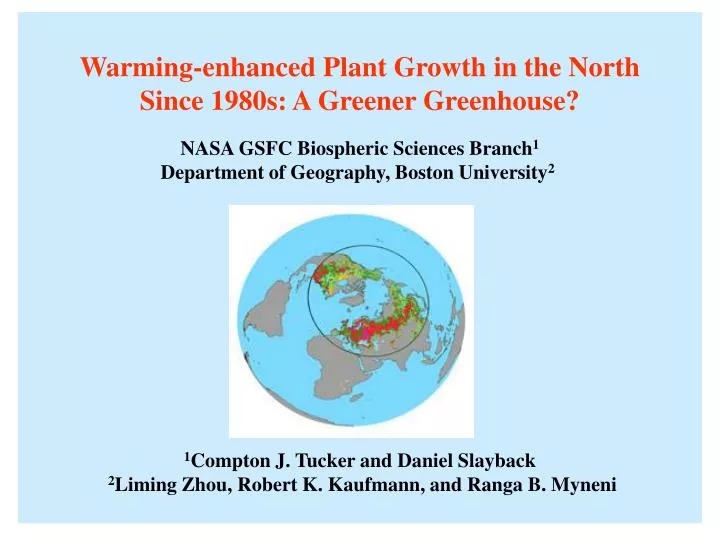
Warming-enhanced Plant Growth in the North Since 1980s: A Greener Greenhouse? NASA GSFC Biospheric Sciences Branch1 Department of Geography, Boston University2 1Compton J. Tucker and Daniel Slayback 2Liming Zhou, Robert K. Kaufmann, and Ranga B. Myneni
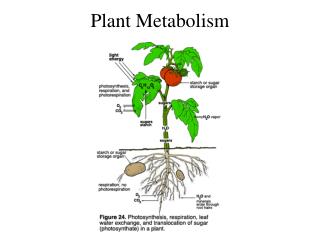
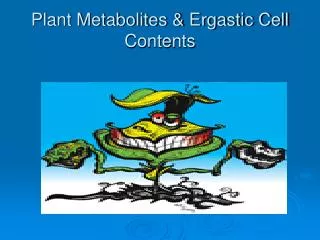
Changes in Climate Changes in Vegetation Pronounced warming in northern high latitudes Earlier disappearance of snow in spring Increased precipitation in northern high latitudes Increased concentration of atmospheric CO2 Increased productivity through: - enhanced photosynthesis - enhanced nutrient availability Has Vegetation Responded to Climate Change?
cooling warming Continental Differences in Warming • Overall warming in Eurasia. Lower warming and even cooling in North America Land surface April-October temperature trends in C/18 yrs between 1982 and 1999 (NASA GISS Station Temperature data)
GIMMS NDVI • 15-day composite NDVI data at 8 km resolution (07/81-12/99) • improved calibration • corrections for stratospheric aerosol effects from El Chichon and Mt. Pinatubo eruptions
Study Region • Vegetated pixels between 30N-70N • Objectives • minimize the effect of Solar Zenith Angle • reduce background effects (snow, barren and sparsely vegetated areas) • use data from the same pixels in the entire analysis.
delayed fall earlier spring Jan Jul Aug Dec NDVI Jan Jul Aug Dec Changes in Vegetation Activity • Changes in vegetation activity can be characterized through • changes in growing season • changes in seasonal NDVI magnitude Increases in growing season Increases in NDVI magnitude Increase NDVI
Longer Growing Seasons (Increased by 12 Days) 11.9 days/18 yrs (p<0.05) (Increased by 18 Days) 17.5 days/18 yrs (p<0.05)
Increases in April-October NDVI Magnitudes (8 Percent Increase) 8.4/18 yrs (p<0.05) (12 Percent Increase) 12.4/18 yrs (p<0.05)
Spatial Pattern of April-October NDVI Changes Persistence index: an index for identifying regions where NDVI has increased consistently A persistent increase in NDVI is observed in Eurasia over a broad contiguous swath of land while North America shows a fragmented pattern of change.
April-October NDVI trend at the 5% significance level Pixels that show a statistically significant trend are also pixels with high persistence.
April-October NDVI difference between 1995-99 and 1982-86 averages Pixels that show a large NDVI increase are also pixels with high persistence and statistically significant trends.
Consistency between April-October NDVI and Temperature R=0.79 (p<0.01) R=0.72 (p<0.01) Year-to-year changes in growing season NDVI are tightly linked to year-to-year changes in temperature.
Statistical Results • A statistically meaningful relation between NDVI and temperature is seen in both North America and Eurasia. • No relationship between Eurasian NDVI and North American temperature or between North American NDVI and Eurasian temperature.
Conclusions • Eurasia is photosynthetically more vigorous than North America during the past two decades: • Eurasia has a higher percentage of vegetated pixels (61% vs. 30%) showing a larger increase in the NDVI magnitude (12% vs. 8%) and a longer active growing season (18 vs. 12 days) than North America. • The temporal changes and continental differences in NDVI are consistent with land surface temperature, an important determinant of biological activity. • Economic implications: warmer planet, greener north.
Press Coverage • Earth is Becoming a Greener Greenhouse • (NASA, AGU and BU Joint Release Sep-4-2001) • TV (ABC, BBC, CNN, MSNBC etc.) • Broadsheets (Hundreds) • Radio (NPR, VOA, BBC, etc.) • Wires (AP, Reuters, etc.) • Internet News Magazines (about a hundred) • Magazines (Science, Sci. Am., Natl. Geog., Popular Science, etc.) • Countries: 20 • Web site hits: 9084 as of Oct 25