Download
1 / 30
300 likes | 436 Views
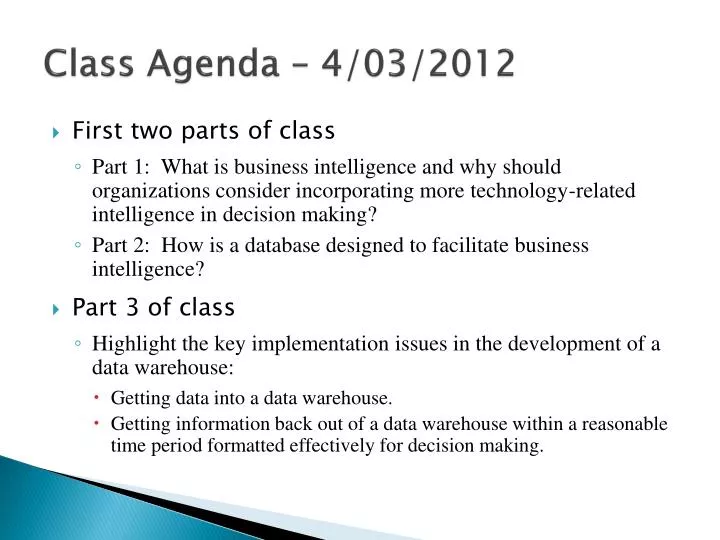
Class Agenda – 4/03/2012. First two parts of class Part 1: What is business intelligence and why should organizations consider incorporating more technology-related intelligence in decision making? Part 2: How is a database designed to facilitate business intelligence? Part 3 of class

E N D
Class Agenda – 4/03/2012 • First two parts of class • Part 1: What is business intelligence and why should organizations consider incorporating more technology-related intelligence in decision making? • Part 2: How is a database designed to facilitate business intelligence? • Part 3 of class • Highlight the key implementation issues in the development of a data warehouse: • Getting data into a data warehouse. • Getting information back out of a data warehouse within a reasonable time period formatted effectively for decision making.
Objectives relevant to SQL Server BI • Design a database to support decision making. • Practice: implement a pre-defined database to see how it is used for decision making. • Describe the components of a data warehouse. • Practice: create a data store; use ETL to populate the data warehouse; implement OLAP; use visualization tools. • Understand the issues that affect the success and failure of implementing data warehousing and BI applications. • Practice: Experience the complexity of a “simple” but comprehensive BI tool. • Port of Subs: implement a small data warehouse.
Review: Components of a BI System • Data warehouse • Structured, unstructured, internal, external, transaction-level, and derived data. • Data storage repository. • Extract, transform and load methods • Methods of loading accurate and consistent data into the data warehouse. • Methods of integrating data from disparate sources. • Metadata repository • Data definitions and meanings. • Business rules and process decisions. • Analytical tools • OLAP: Online Analytical Processing • Statistical analysis. • Data Mining. • Data Visualization • Dashboards. • Graphical, tables, pictures.
Reporting Services (SSRS) SQL Server database (SSDB) Integration Services (SSIS) AnalysisServices(SSAS)
SQL Server Database (SSDB) • Relational database management system. • Aligns with rules of a relational DBMS. • Transact-SQL. • Includes metadata repository. • SQL Server Management Studio. • Accessible from UNR COB labs through remote desktop; a college resource rather than a university resource.
SQL Server Integration Services (SSIS) • Extract, transform, load package. • Create ETL processes without having to perform custom programming. • Imports from a variety of differing data formats, exports to SQL Server or to other data formats. • Drag and drop “programming”. • Has standard processes (examples: data transformation, reformatting, aggregation). • Bulk load data with standardized procedures. • Accessible from the Business Intelligence Development Studio.
SQL Server Reporting Services (SSRS) • Server-based reporting platform. • Reports can be delivered via a browser, a Windows application, or a SharePoint site. • Used by both IS professionals and power users. • Accessible from the Business Intelligence Development Studio.
SQL Server Analysis Services (SSAS) • Creates a pre-defined, pre-calculated “cube” for analysis. • A method of “avoiding” creating a data mart; create a “cube” through analysis services, and deliver that cube to end users for further analysis. • Termed the “unified dimensional model” by Microsoft. • Accessible from the Business Intelligence Development Studio.
Let’s learn SQL Server Business Intelligence Tools through a practice tutorial Maximum Miniatures (MaxMin, Inc.)
MaxMin BI-type Information (pg. 103) • Number of accepted and rejected products by batch, by product, by machine, by day. • Elapsed time for molding and hardening by product, by machine, by day. • Elapsed time for painting and curing by paint type, by product, by machine, by day. • Product rolls up into product subtype, which rolls up into product type. • Day rolls into month, which rolls into quarter, which rolls into year. • The information should be able to be filtered by machine manufacturer and purchase date of the machine.
What are the steps of the exercise? • Build the database through Management Studio. • Populate the database through SSIS. • Create a data mart “cube” with SSAS. • Look at the “cube” with SSRS. • Look at the “cube” with a pivot table in Excel.
Building the database • Can use SQL CREATE statements or follow the wizard instructions in the book. • Issues to be aware of: • No constraints other than primary keys. • Referential integrity is not maintained. • I provide SQL CREATE statements if the wizards prove problematic.
Populating the database • Performed through batch process – extract, transform and load. • Usually automated. • Will create two batch processes • The first process populates most of the dimension tables. • The second process populates the last dimension table and both of the fact tables. • Will demonstrate control flows and data flows
Population is an ongoing process • Data population occurs at time intervals relevant to the business. • Individuals should NOT populate tables online; everything should populate through the batch process. • Batch process should be fail safe.
Querying the database • SQL SELECT statements • Can access the data warehouse like any other database. • Even medium-size databases may be slow, especially if there is much aggregation required. • Indexing is critical. The exercises do not demonstrate indexing, we will discuss it after you have a chance to do the exercises. • OLAP (online analytical processing) • Pre-defined aggregation. • Build another data structure to sit on top of the relational database, or serve as a replacement for the relational database. • Goal is to radically decrease access time.
Building the OLAP Query • Will use Analysis Services in SQL Server BI. • What will you do? • Define the structure of the cube. • Define the data sources of the cube. • Define the hierarchical structures to use for aggregation. • Define the aggregations. • Build the cube. • Deploy the cube.
What do you do with an OLAP cube? • Look at it. • Use whatever visualization method is available to look at the cube. • Excel pivot table. • Report generator. • Management Studio. • Use it for additional processing. • Can run specialized queries in whatever language is available. In SQL Server, that language is MDX • Can access it via other programming languages and MDX • Use it as a source for data mining (can also use database for data mining).
Visualization tools • Remember: Purpose of a data warehousing system is to get information to support decision making. • What visualization tools will we use? • Excel • SQL Server Reporting Services • Reporting Services can produce: • Standard paper-type reports. • Web-based reports. • Charts (either paper or web-based).
How does data mining fit in?An additional way to evaluate data • Provides multi-dimensional data analysis techniques. • Works primarily with data aggregation. • Provides advanced statistical analysis. • Provides advanced graphical output. • Supports access to very large databases. • Provides enhanced query optimization algorithms. • Analyze the data; uncover patterns hidden in the data; form computer models based on the findings; and use the models to predict business behavior. • Proactive tools, used for prediction and discovery of behavior. • Some are based on standard statistical tools of correlation and regression • Most are based on artificial intelligence software such as decision trees, neural networks, fuzzy logic systems, inductive nets and classification networking. Online Analytical Processing (OLAP) Data Mining
Contrast between OLAP and Data Mining Decision Support Questions • Which customers spent the most with us in the past year? • How much did the bank lose from loan defaulters within the past two years? • What were the highest selling fashion items in our San Diego stores? • Which store/location made the highest sales in the past year? • Which types of customers are likely to spend the most with us in the coming year? • What are the characteristics of the customers most likely to default on their loans before the year is over? • What additional products are most likely to be sold to customers who buy shorts? • In which area should we open a new store next year? Online Analytical Processing (OLAP) Data Mining
What are you supposed to do?? • Do the book exercises to learn how to use SQL Server BI tools. • Additional instructions provided and available on the class web site. • Logins and databases have been created for you on SQL Server. • You have access to Management Studio and Business Intelligence Development Studio. • You have access via remote desktop. • Name of the computer is STS.COBA.UNR.EDU • Name of our instance of SQL Server is BSQL\Students
What are we going to do in class? • Discuss the conceptual issues surrounding the BI applications: • ETL • Pre-processing aggregations and other data. • Data mining • Data visualization • Answer questions about the book exercises.