Download
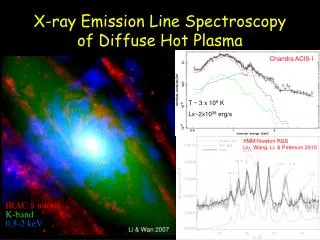
1 / 68
680 likes | 756 Views
Quantitative Analysis of Resolved X-ray Emission Line Profiles of O Stars. David Cohen Department of Physics & Astronomy Swarthmore College. With Maurice Leutenegger, Asif ud-Doula, Rich Townsend, and Stan Owocki. May 2, 2007: American Museum of Natural History.

E N D
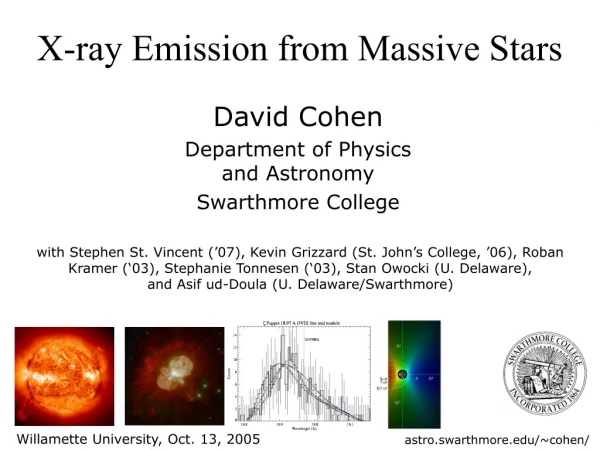
Quantitative Analysis of Resolved X-ray Emission Line Profiles of O Stars David CohenDepartment of Physics & AstronomySwarthmore College With Maurice Leutenegger, Asif ud-Doula, Rich Townsend, and Stan Owocki May 2, 2007: American Museum of Natural History astro.swarthmore.edu/~cohen/presentations/AMNH_2May07/
X-ray Production in Hot Stars David CohenDepartment of Physics & AstronomySwarthmore College With Maurice Leutenegger, Asif ud-Doula, Rich Townsend, and Stan Owocki May 2, 2007: American Museum of Natural History astro.swarthmore.edu/~cohen/presentations/AMNH_2May07/
Quantitative Analysis of Resolved X-ray Emission Line Profiles of O Stars:Profile symmetry, clumping, and mass-loss rate reduction David CohenDepartment of Physics & AstronomySwarthmore College With Maurice Leutenegger, Asif ud-Doula, Rich Townsend, and Stan Owocki May 2, 2007: American Museum of Natural History astro.swarthmore.edu/~cohen/presentations/AMNH_2May07/
OUTLINE • Hot-star X-rays in context -> the discovery of X-ray emission from OB stars in the late 70s came as a surprise • Hot-star winds • Chandra spectra: emission lines are broad • Emission line shapes (and line ratios) -> normal O supergiant X-rays are understood in terms of the wind-shock scenario…but mass-loss rates must be lower than has been assumed
OUTLINE • Hot-star X-rays in context -> the discovery of X-ray emission from OB stars in the late 70s came as a surprise • Hot-star winds • Chandra spectra: emission lines are broad • Emission line shapes (and line ratios) -> normal O supergiant X-rays are understood in terms of the wind-shock scenario…but mass-loss rates must be lower than has been assumed
The Sun is a strong source of X-rays Lx ~ 10-5 LBolTx ~ few 106 K both are higher for active M stars & low-mass PMS stars The hot plasma is generally confined in magnetic structures above – but near - the surface of the Sun.
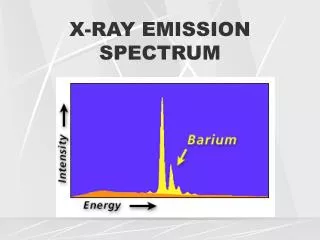
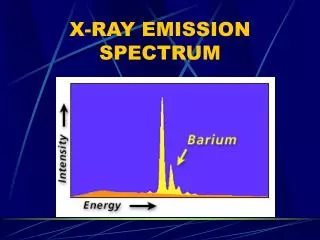
Coronal Spectra visible solar spectrum X-ray/EUV solar spectrum: narrow emission lines from hot, optically thin plasma
This hot plasma is related to magnetic fields on the Sun: confinement and heating; also spatial structure, conduits of energy flow
The Sun’s magnetic dynamo requires rotation + convection to regenerate and amplify the magnetic field Note granulation, from convection Sunspots over several days: rotation
The Sun and other cool stars emit X-rays associated with magnetic activity, related to convection and rotation… But what of hot, massive stars?
Hot, Massive Stars Representative properties: B0 V: T=30,000 K, M=20Msun, L=105Lsun O5 I: T=40,000 K, M=40Msun, L=106Lsun Stars hotter than about 8000 K do not have convective envelopes - no convection - no dynamo - no hot corona… …no X-rays ?
Our Sun is a somewhat wimpy star… zPuppis (O4 If): 42,000 K vs. 6000 K 106 Lsun 50 Msun
In 1979 the Einstein Observatory made the surprising discovery that many O stars are strong X-ray sources Chandra X-ray image of the Orion star forming region q1Ori C: a Teff=40,000 K O7 V star (very young, too)
Strong correlation between rotational velocity and x-ray luminosity in solar-type stars No Lx – vsini correlation in O stars Sciortino et al., 1990, ApJ, 361, 621 Maggio et al, 1987, ApJ, 315, 687 Note higher Lx values for O stars; Lx ~ 10-7 LBol
So, we’ve got a good scientific mystery: how do massive, hot stars make X-rays? Could we have been wrong about the lack of a magnetic dynamo - might massive star X-rays be similar to solar X-rays? Before we address this directly, we need to know about one very important property of massive stars…
OUTLINE • Hot-star X-rays in context -> the discovery of X-ray emission from OB stars in the late 70s came as a surprise • Hot-star winds • Chandra spectra: emission lines are broad • Emission line shapes (and line ratios) -> normal O supergiant X-rays are understood in terms of the wind-shock scenario…but mass-loss rates must be lower than has been assumed
Hot star winds deposit significant amounts of (enriched) matter, momentum, and energy into the galactic environment NGC 7635, a Wolf-Rayet star with a mass-loss rate of nearly 10-4 Msun yr-1
UV absorption lines are the most direct, quantitative means for diagnosing hot-star wind properties wavelength O4 I rest wavelength(s) – this N V line is a doublet You can read the terminal velocity rightoff the blue edge of the absorption line B0 V bluevelocity (km/s)red
P Cygni line formation Absorption comes exclusively from region F - it’s all blue-sifted Red-shifted emission from scattered photospheric radiation
The steady winds of normal O stars are radiation-driven electron with cross section,sT(cm2) The flux of light, F (ergs s-1 cm-2) The rate at which momentum is absorbed by the electron radiative acceleration in fact, they are line-driven: k=k(l)
Radiation driving in spectral lines As the radiation-driven material starts to move off the surface of the star, it is Doppler-shifted, making a previously narrow line broader, and increasing its ability to absorb light. Opacity, k – and thus the radiation force - is a function of the local acceleration (F -> a -> F…) cont. 0 Optically thick line – from stationary plasma (left); moving plasma (right) broadens the line and increases the overall opacity.
Line driving has an inherent instability photospheric spectrum, illuminating the line line profile function (kn) of an ion in the wind
If the ion is perturbed, it moves out of the Doppler shadow, absorbs more radiation, and is further accelerated…
The Doppler desaturation that’s so helpful in driving a flow via momentum transfer in spectral lines is inherently unstable The line-driven instability (LDI) should lead to shock-heating and X-ray emission
Numerical modeling of the hydrodynamics show lots of structure: turbulence, shock waves, collisions between “clouds” This non-linear behavior is predicted to produce X-rays through shock-heating of some small fraction of the wind.
A snapshot at a single time from the same simulation. Note the discontinuities in velocity. These are shock fronts, compressing and heating the wind, producing x-rays. Most of the wind mass is in dense inter-shock regions, in which cold material provides a source of photoelectric absorption
Other groups find similar wind structure in their simulations from Feldmeier et al., 1997, A&A, 322, 878
There’s ample evidence for wind clumping Optical line profile variability in WR stars: from Lepine et al., 2000, ApJ, 120, 3201
Wind structure and physical properties Highly time-dependent, but statistically quite constant Small pockets of hot plasma, embedded in a cold (T~Teff) wind with a standard beta-law velocity profile
Another rad-hydro simulation, but plotted in Lagrangian coordinates. The shock-heated regions are a small fraction of the wind mass Runacres & Owocki, 2002, A&A, 381, 1015
Statistics from a long rad-hydro run (vs. radius) clumping factor rclump/<r> velocity dispersion density-velocity correlation Runacres & Owocki, 2002, A&A, 381, 1015
OUTLINE • Hot-star X-rays in context -> the discovery of X-ray emission from OB stars in the late 70s came as a surprise • Hot-star winds • Chandra spectra: emission lines are broad • Emission line shapes (and line ratios) -> normal O supergiant X-rays are understood in terms of the wind-shock scenario…but mass-loss rates must be lower than has been assumed
Globally, O star X-ray spectra look like coronal spectra Mg XII • Pup (O4 I) Si XIV Ne X Fe XVII Ne IX O VIII O VII N V 10 Å 20 Å
Focus in on a characteristic portion of the spectrum 12 Å 15 Å • Pup (O4 I) Capella - a cooler star: coronal/dynamo source Fe XVII Ne X Ne IX
Each individual line is significantly Doppler broadened (here is Ne X Lya at 12.13 Å) lab/rest wavelength • Pup (O4 I) HWHM ~ 1000 km/s Capella (G2 III) An unresolved line in a solar-like coronal source, for comparison
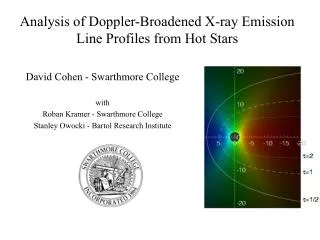
The line shapes in O star x-ray spectra provide information about the kinematics of the hot plasma in their winds • Pup (O4 I) Note: the line isn’t just broad, it’s also blue shifted and asymmetric Capella (G2 III)
OUTLINE • Hot-star X-rays in context -> the discovery of X-ray emission from OB stars in the late 70s came as a surprise • Hot-star winds • Chandra spectra: emission lines are broad • Emission line shapes (and line ratios) -> normal O supergiant X-rays are understood in terms of the wind-shock scenario…but mass-loss rates must be lower than has been assumed
To analyze data, we need a simple, empirical model Detailed numerical model with lots of structure Smooth wind; two-component emission and absorption
Spherically symmetric wind; specified filling factor of hot plasma blue red wavelength Contours of constant optical depth (observer is on the left) continuum absorption in the bulk wind preferentially absorbs red shifted photons from the far side of the wind
The profile shapes are affected by the spatial and kinematic distribution of the hot plasma, AND by the amount of attenuation by the cold wind, characterized by the optical depth parameter: Ro=1.5 for r>Ro Ro=3 The line profile is calculated from: Ro=10 Increasing Ro makes lines broader; increasingt*makes them more blue shifted and skewed. t=1,2,4
In addition to a wind-shock scenario, our empirical line-profile model can also describe a corona With most of the emission concentrated near the photosphere and with very little acceleration, the resulting line profiles are very narrow.
We fit all the unblended strong lines in the Chandra spectrum ofzPup: all the fits are statistically good Ne X 12.13 Å Fe XVII 15.01 Å Fe XVII 16.78 Å N VII 24.78 Å Fe XVII 17.05 Å O VIII 18.97 Å Kramer, Cohen, & Owocki, 2003, ApJ, 592, 532
We place uncertainties on the derived model parameters lowest t* best t* highest t* Here we show the best-fit model to the O VIII line and two models that are marginally (at the 95% limit) consistent with the data; they are the models with thehighestandlowestt*values possible.
Summary of profile fits to z Pup’s Chandra emission lines Ro t* onset of X-ray emission at ~1.5 R* some opacity, but optical depths are low
Let’s look at another normal O supergiant z Ori: Alnitak O9.7 I wind is less dense than z Pup’s
z Ori (O9.7 I) – still the lines are broad, shifted, and asymmetric 94% 73% An unshifted Gaussian doesn’t fit A shifted Gaussian fits OK A kinematic model with absorption fits better 54% Rejection probabilities are shown on the right of each panel.
Fit results for z Ori summarized t* The onset radii (left) are exactly what’s expected from the standard wind-shock picture. There is evidence for attenuation by the cold wind (right), but at levels nearly 10 times lower than expected. This is the same result that we found for z Pup.
Mass-loss rates of O stars may need to be revised downward • Several different lines of evidence: • P V absorption (FUSE) [Fullerton et al. 2006] • Density-squared emission – radially varying clumping (H-alpha and radio free-free) [Puls et al. 2006] • Detailed atmosphere + wind UV modeling [Bouret et al. 2003]
Clumping in the cold, absorbing wind can reduce the overall effective opacity: Can clumping explain the relative symmetry of the profiles? h=h’r/R* L’=0.1 The key parameter for describing the reduction in effective opacity due to porosity is the ratio of the clump size scale to the volume filling factor: h=L/f. We dub this quantity the porosity length, h. Density contrast matters, but so does inter-clump spacing.