Download
1 / 34
340 likes | 555 Views
Planning with the Delaware Valley’s Communities and Public John Ward, DVRPC Associate Director Planning Division. Mid-Atlantic Regional Planning Roundtable November 9, 2007. Presentation Overview. Regional Perspective Linking Planning and Operations Taming Traffic in Communities

E N D
Planning with the Delaware Valley’s Communities and Public John Ward, DVRPC Associate Director Planning Division Mid-Atlantic Regional Planning Roundtable November 9, 2007
Presentation Overview • Regional Perspective • Linking Planning and Operations • Taming Traffic in Communities • Transit Visioning with the Public
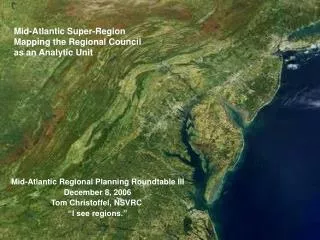
Philadelphia Metropolitan Area • DVRPC is the MPO for the Nine County Philadelphia Region • 5.5 Million People • 2.8 Million Jobs • 3,814 Square Miles • 353 Municipalities
Planning For Operations • Transportation Systems Management & Operations • Closed Loop Traffic Signal Optimization • Transportation Emergency Evacuation Program • Transportation System Security • Incident Management
Planning For Operations Incident Management • DVRPC Task Forces • I-76/I-476 Crossroads • I-295/I-76/NJ 42 Task Force • I-95 Philadelphia • Additional Task Forces • PA 309 (GVFTMA) • US 422 (GVFTMA) • Atlantic City Expressway (SJTA) • I-95 Bucks County, PA (Bucks County TMA) • I-95/I-476 (future - Delaware County TMA) • I-295 Mount Laurel, NJ (future - NJDOT)
Incident Management Successes: Policy and Procedures Manual • Provide responders uniform operational guideline for safe operations at the scene of an incident. • Goal: Improve the overall traffic incident management process, which will then: • Improve emergency responder safety • Reduce secondary incidents • Restore traffic flow • General Topics: • Unified Incident Management System • Lane Identification • Recommended Equipment • Arriving on Scene • Traffic Control • Operating on Scene
Incident Management Successes: Ramp Designation Pennsylvania New Jersey
Technical Assistance to Agencies • NJDOT • Produced Map of NJDOT ITS Assets in South Jersey • Published Detour Routes for Ocean County, New Jersey • PennDOT • Created Internet Application of Expressway Detour Routes • Providing GIS Mapping of Traffic Signal Systems and Fiber Network • County 911 Centers • Assisted in Providing PennDOT CCTV Video • ITS and Incident Management Training Courses
IDRuM: Interactive Detour Route Mapping Internet application for accessing PennDOT detour routes Step 2: Select Incident Location Step 1: Select Highway Step 3: View / Download / Print / Email Map Formats Used: Steps 1 & 2: Macromedia Flash Step 3 (final map): Adobe PDF Both formats are available for FREE download
Taming Traffic in Communities • Annual study included within DVRPC’s work program • Two sites studied each year • Sites are nominated by counties and cities • Sites are assessed based on a series of criteria and data: • area type • posted speed limit • AADT • crashes • roadway type • community facilities • public support
Study Priorities • Priority Is Given to Areas Where: • Potentially hazardous conditions may be eased through CSS and traffic calming • Travel speeds are reported to be inappropriate for the surrounding context • Roadways are unnecessarily wide or confusing • There is recent change in existing conditions, including an increase in pedestrian activity • The infrastructure supports intermodality • There is proximity to schools, recreation, residential, shopping,or transit-oriented destinations
What Are Context-Sensitive Solutions? A transportation planning strategy that: • Looks "beyond the pavement“ • Develops capital improvements with community in mind • Enhances communities and natural environments • Balances the competing needs of all modes of travel • Links driving behavior with perception of the surrounding context • Focuses on community values and qualities • Objectively evaluates a full range of alternatives
CSS Toolkit PLACEMAKING ELEMENTS • Decorative lighting, landscaping and public art • Materials that reflect the style and fabric of the surrounding community PEDESTRIAN/ BIKE/ TRANSIT AMENITIES • Bold and texturally distinct crosswalks • Pedestrian signal heads and push buttons • Designated bike lanes • Transit shelters, including amenities
CSS Toolkit: Smart Growth Development • Focusing development around concentrated main streets and mixed-use communities may create a different type of roadway character • Big-box stores can be adapted to portray more of a town-center type of character, thereby encouraging slower speeds
CSS Toolkit: Traffic Calming • “The combination of mainly physical measures that reduce the negative effects of motor vehicle use, alter driver behavior and improve conditions for non-motorized street users.” – ITE • Strategies: engineering, education, enforcement and policy • The most effective and long-term traffic calming techniques are engineering measures • Complementary to other CSS strategies
Traffic Calming Engineering Techniques Volume Control • Full Street Closures • Half Street Closures •Diagonal Diverters • Forced Turn Islands • Median Barriers Vertical Speed Control • Speed Humps • Speed Tables • Raised Intersections • Textured Pavements Horizontal Speed Control • Roundabouts • Chicanes • Lateral Shifts • Realigned Intersections Narrowing Speed Control • Neckdowns/ Bulbouts • Center Islands • Chokers
Dots & Dashes: Public Outreach on Transit • Funded through the Federal Transit Administration Public Transportation Participation (PTP) Pilot Program
Dots & Dashes: Background & Purpose • Meaningful public and stakeholder discussion of regional transit investment priorities through a working charrette (“game”) • Costs are constrained to force group negotiation, prioritization, and consensus-building • Outreach outcomes will Inform priorities for DVRPC’s next Long Range Plan and generate ideas and preferences for a new Regional Vision Plan for transit
Dots & Dashes: Game Pieces Small dots: • Stations • Parking garages • Station parking lots Big dots: • Major stations with structured parking • Transportation Centers (i.e. Norristown, Paoli)
Dots & Dashes: Game Pieces Rapid bus dashes: • 3” = $10 Million • In-Street BRT projects OR • Express bus lines with stations Rail dashes: • 3” = $500 Million • Used for all types of rail (light rail, subway / El, commuter/regional rail) • Cost is averaged for all types of rail
Dots & Dashes Dollars and Sense • Costs for dot and dash are derived from the costs of real transit projects drawn from the New Starts pipeline and transit agency capital programs, with adjustments to 2030 dollars. • Based on testing, a ‘total budget’ cap of $5 billion was assigned to ensure constrained preferences and priorities for investments over a 20+ year timeframe (through 2030). • Emphasis in LRP is on siting development in assigned “Development Centers”, also makes use of “Transit Score” which links land use and transit potentials
Dots & Dashes: Group Decisions • Groups begin by deciding how to split their spending on: • Improvements to the existing system (e.g. fare modernization, greater frequencies, station enhancements) • Network expansion (new rail corridors, BRT corridors, transportation centers, or major station expansions) • Specific ‘existing system’ improvements are identified in writing, and the rest of the game is played to identify, distribute, and roughly cost out network expansion improvements on the regional game board
Dots & Dashes: Preliminary Results • We have a working outreach tool, shown to engage public discussion of preferences and reach group consensus on transit priorities • Data results from two sessions have been entered into a database for aggregation and analysis • Composite results (projects and investments that groups most frequently prefer) will inform regional plans • A central public game session was held this week, there will be a series of sessions involving DVRPC committees and affiliated agencies
Contact Information Contact InformationJohn Ward Associate Director, Planning Division Delaware Valley Regional Planning Commission (215) 238-2899 jward@dvrpc.org www.dvrpc.org