Download
1 / 11
110 likes | 254 Views
Human Capital Metrics Benchmarking Project. Workforce Intelligence Group 23 January 2008. Should we collect workforce intelligence?. Why we should collect workforce data?. Workforce planning Retaining talented workforce Organisational performance Boroughs ask for it!!!!! Any more?.

E N D
Human Capital Metrics Benchmarking Project Workforce Intelligence Group 23 January 2008
Why we should collect workforce data? • Workforce planning • Retaining talented workforce • Organisational performance • Boroughs ask for it!!!!! • Any more?
Background to the project • Previous incarnation PMPI Survey • Jan 2007 metric workshop • Human capital metrics handbook • Summer – Autumn 2007 – identified metrics and produced definitions.
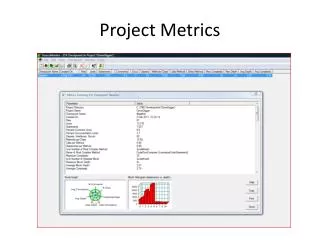
Data Collection • Quarterly • Excel spreadsheet • Benchmarking data
Survey Results – Most important metrics to organisation Top Five • Avg No. working days lost • Ethnicity as % of HC • Disability as % of HC • Cost of agency staff • Agency staffing rate Bottom Five • Promotion rate • Average age • Turnover by length of service • HR operating cost • Cost of absence
Questions? • Are we simply reporting what we can report? • Are external reporting requests (AC, ONS) dictating what we report?
Metric Focus – Promotion Rate • UK firms are providing too few opportunities for career development (ISR Research) • Career and development opportunities are the main reasons people leave employment (CIPD) Related measures: Promotion speed ratio,upward mobility, career path ratio
Survey Results – Populating metrics Least difficult • Gender as % of avg headcount • Ethnicity as % of HC • Turnover rate • Average age • Disabilty & Age as % of HC Most difficult • Promotion rate • HR operating cost • Cost of absence • Cost of HR per employee • Avg time taken to recruit
Issues • Response rates • Terminology/definitions Future • More boroughs involved • Use data for benchmarking • Data warehouse