Download
1 / 36
360 likes | 500 Views
Is the economic growth from the emerging economies additional?. Second Gresham Lecture Douglas McWilliams Mercers School Memorial Professor of Commerce at Gresham College with Thras Moraitis , Member of Executive Board Xstrata plc and

E N D
Is the economic growth from the emerging economies additional? Second Gresham Lecture Douglas McWilliams Mercers School Memorial Professor of Commerce at Gresham College with ThrasMoraitis, Member of Executive Board Xstrata plc and Michael McWilliams, Global head of Hydro, Mott MacDonald Centre for economics and business research ltd Unit 1, 4 Bath Street, London EC1V 9DX t: 020 7324 2850 f: 020 7324 2855 e: advice@cebr.com w: www.cebr.com
Objective • To understand the main constraints on world economic growth, to assess the consequences of constrained economic growth and to discuss what policy measures could limit these constraints
Overview • What are the key constraints on world economic growth?: • Economic • Environment • Food • Minerals • Energy • Water
Overview (continued) • Can technologies change the impact of these constraints? • If growth is constrained what are the implications – for the emerging economies and for the Western economies? • What policy measures will allow faster growth by limiting the extent to which shortages hold growth back?
Economic uncertainty • The Western financial crisis is and its aftermath are likely to be with us for perhaps 5-10 more years, constraining growth as balance sheets are rebuilt and governments retrench • The euro problem is going to retard world and especially European growth - either through the disruptive effect of the collapse of the euro or through the long period of internal adjustment to misaligned real exchange rates – this problem could affect economic performance for twenty years or so • When disruptive change is taking place, there is an increased probability of mistaken policies and decisions that will retard growth – we have seen some examples of this and cannot rule out others
The environment • There are serious environmental risks from continued world growth even if there is no acceleration from past levels • Stern report indicates potential loss of 5% of GDP growth from the environment • But this has been largely discredited – but still a possible impact of 1% according to serious study by Peter Lilley • Also needs to be taken into account is the cost of ‘pro environmental’ policies affecting the costs and supplies of primary products and energy
Food supplies • Amount of agricultural land under cultivation has been essentially static since the 1960s • FAO report indicates that it should be possible to generate enough food at least till 2050 • $209 billion of gross investment annually (at 2009 prices) will be required • This compares with $142 billion investment annually over the past decade • FAO estimated impact of GM food to reduce the average world price of food by 13-40% (though no timeframe is suggested) • Differential development of GM food is affecting relative competitiveness of economies – main use of GM in US and Latin America including Brazil • NB water requirements
Income trends correlate strongly with urbanisation…as does demand for commodities
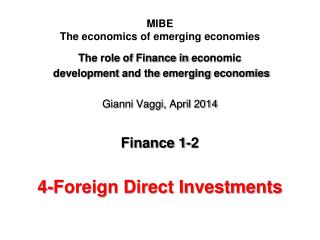
Commodities display different demand profiles as economies evolve Commodity Intensity1 (Unit consumption/GDP per Capita) Energy consumption is expected to grow rapidly (trillion kWh) • US GDP: ~$42k/capita • China GDP: ~$7.3k/capita • India GDP: ~$3.2k/capita Late cycle commodities e.g. platinum, nickel Mid-cycle commodities e.g. copper, lead, zinc Early cycle commodities e.g. steel, iron ore GDP per capita (real, 2005 $US) Flags show 2010 kWh per capita consumption • Source: IMF, USGS, CIA Factbook • Note: 1 Stylised intensity curves based on developed countries, Indexed to 100 at maximum • Source: International Copper Association, Xstrata Estimates • Note: Assuming today’s energy mix
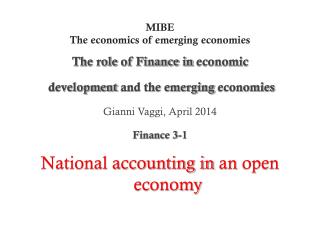
Multi-decade structural price trends are not unprecedented The industrialisation of China and other BRICs represents a demand shift an order of magnitude greater than those in USA, Europe and Japan Copper Price (real terms) US$/t Industrialisation of the USA Rebuilding of Europe, the growth of Japan and the Oil shock Industrialisation of China and other BRICs
Maintaining supply from existing sources is becoming increasingly challenging amid rapidly declining ore grades and aging mines Source: Wood Mackenzie, Xstrata estimates. Deutsche Bank …mean producers have to “run harder to stand still” Declining head grades … Head grades, indexed to 2000 base Copper supply is falling short of expectations
Natural resource companies are compelled to access future resources in ‘new’ geographies Source: Bloomberg, Wood Mackenzie, WBMS Russia(copper, iron ore, thermal coal, coking coal, zinc, nickel) Ukraine(iron ore, thermal coal, coking coal) Highly Prospective New Frontiers Kazakhstan(copper, zinc, oil, FeCr, iron ore) Mongolia(copper, thermal coal, coking coal) Turkey(copper) Venezuela(copper, thermal coal, nickel) China(copper, iron ore, thermal coal, coking coal, zinc, nickel, aluminium) Mexico(copper, iron ore, thermal coal, zinc) Rep Congo (iron ore) Mauritania, Sierra Leone, Guinea(iron ore) India(copper, iron ore, thermal coal, zinc, nickel) Eq. Guinea, Cameroon (oil/gas) D.R. Congo and Zambia (copper) Colombia(thermal coal) Tanzania (nickel) Philippines, Papua New Guinea, New Caledonia(copper, nickel) Ecuador(copper) Botswana(copper) Mozambique(thermal coal) Peru and Chile(copper, iron ore, zinc) South Africa(iron ore, thermal coal, coking coal, zinc, nickel) Indonesia(thermal coal, coking coal, nickel) Brazil(copper, iron ore, nickel) Argentina(copper)
A substantial proportion of future capital is in these new geographies Geographic origin of new copper supply to 2020 Value of Au, Cu, Ni, Fe projects started $bn • Source: McKinsey Cumulative probable mine project supply 2011 to 2020 Source: BrookHunt, MEG, Xstrata estimates
Insufficient infrastructure & associated costs in new geographies drive cost and complexity Source: Wood Mackenzie, Xstrata Estimates Note: bubble size denotes annual copper equivalent production Increased Capital Intensity of Projects Salobo I Oyu Tolgoi Caserones Sierra Gorda Tenke Antapaccay 2011 $US/t Cu equivalent annual production Capital intensity Esperanza Start date 1985 to 2011 greenfield projects Xstrata projects under construction-combined position 2012 to 2015 greenfield projects in construction
The vast majority of mega projects have experienced cost and schedule over-runs Source: McKinsey
Increasingly complex social and government issues are retarding new production Changing regulation gives a stronger voice to community opposition to mining projects, e.g. new IFC Standard 7 Complex re-negotiations and land purchase requirements • Increased competition for land between agriculture and mining, e.g. Queensland government are introducing legislation around “strategic cropping land” NGO involvement • Growing activism against mining, e.g. Friend’s of the Earth legal challenge to coal projects in Australia in respect of climate change Resource nationalism • Increased regulations/taxes/ nationalisation Source: Goldman Sachs research report, 2011
Increased globalisation and consolidation bring about key challenges for the industry
A symbiotic relationship between producers, governments and other stakeholders is essential • Mining Companies • Benefit from: • The Social Licence to Operate • Access to diverse sources of capital • New resources and business opportunities • Key skills • In return: • Provide vital products • Take on risk of investment • Corporate Social Investment • Provide skills and capabilities • Employ sustainable practices • Provide world-class technologies • Contribute to national and local coffers • Governments • Benefit from: • Investment in country • Taxes • Employment • Infrastructure • Products vital to society • In return provide: • Security of tenure and a stable investment regime • Transparency • Infrastructure • A skill base • Communities • Benefit from: • New infrastructure and advanced technology • Jobs, training and development • Corporate Social investment • Development of and procurement from local suppliers and enterprises • In return provide: • The Social Licence to Operate • Employees • Suppliers
Governments can help alleviate some of the important bottlenecks A secular change in demand for commodities is being driven by the industrialisation and urbanisation of over a third of the world’s population The supply of many commodities remains unable to bridge the demand gap Prices for commodities are likely to remain above historical averages for some time Governments are inadvertently hampering the development of much needed new sources of key commodities A symbiotic understanding and approach to resource development is essential to remove unnecessary bottlenecks in supply
2010 data Primary energy sources and use by sector Source: own analysis of IEA data
Mtoe pa 2010 data Region / Country Consumption Source: own analysis of IEA data
2010 data Consumption per capita China, India and Africa have more than 50% of the world’s population and consume less than one-quarter of the OECD average per capita consumption. Source: IEA data
Growth in consumption by region Mtoe +13% +82% +11% Other Major Consumers: China, India, Brazil, Indonesia, Russia and Middle East Source: IEA data (New Policies Scenario)
Growth by fuel type Mtoe +86% +61% +67% +44% +13% +18% Source: IEA data (New Policies Scenario)
Depletion of resources Coal Oil Used in 25 years Resource remaining after 2035 Nuclear Gas Analysis of various sources
Cebr base world growth scenario - oil price assumption WORLD ECONOMIC OUTLOOK Oil prices, average of Brent crude, WTI and Dubai Fateh, $ per barrel, annual average 26
Cebr optimistic world growth scenario - oil price assumption WORLD ECONOMIC OUTLOOK Oil prices, average of Brent crude, WTI and Dubai Fateh, $ per barrel, annual average 27
Water resources • Unlike Energy, all water is renewable; • Even consumptive uses, predominantly irrigation, result in recycling through transpiration and precipitation; • There is plenty of water around – 2/3 of the world’s surface is covered in water; or is there? • 3% of the world’s water is fresh; • Of that 10% is accessible in lakes and rivers; • Around 40 x 1013 cubic metres of renewable “Blue Water” each year in the world; • Average water requirement for food production is 4 cubic metres per day; • World population is around 7 billion • Hence one-quarter of the available water must be harvested to meet demand. All World’s Water Fresh Water Lakes & Rivers Image credit: USGS
The issues • Location of water: • People used to live where water is available; now some 1 billion people live in regions where there is insufficient water; • Population Growth • By 2035 the world’s population will increase from 7 billion to around 8.6 billion (UN estimates) • Urbanisation • By 2035 the percentage of urban population will grow from 52% to 62% - nearly 2 billion more people in urban environments; (UN estimates) • Changing diet • With growing wealth the consumption of meat is increasing; 10 times as much water is needed per kilo of beef compared with bread, raising the average per capita requirement (UN waterfootprint.org) • Climate Change • Impacts on precipitation levels will vary, but more intense rainfall will be harder to harvests • Transboundary issues • Downstream users in water stressed regions of major rivers such as the Nile, Indus and Jordan are increasingly concerned about upstream abstractions, and about treaties which were made in days of lower population and water demand; • CONCLUSION • There will still be sufficient water in 2035, but there is a need for considerable investment in storage, transfer and treatment infrastructure and in improved food production technology.
Cebr world growth scenario – base assumptions for GDP growth World real GDP, annual change, chained volume measure 2000, exchange rates weighted
Cebr world growth scenario – optimistic assumptions for GDP growth World real GDP, annual change, chained volume measure 2000, exchange rates weighted
The count for US oil rigs has risen sharply Source: earlywarn.blogspot.com
The price of Brent crude has been consistently around $20 higher than WTI since 2011 Source: earlywarn.blogspot.com
Natural gas is now selling in the US at the equivalent price to $24 a barrel for oil Source: wallstreetpit.com
Conclusions • It is economically difficult for the world to reorient itself and this in itself is likely to limit growth – and has done so • The environment could hold back growth, though this is not necessary • The technology exists for energy and food supplies to be adequate to allow for growth – fusion power, shale gas and GM foods could be game changers • There are likely to be shortages of minerals to support rapid growth unless government policies change • Further investment in water supplies will be necessary to support rapid growth • Central assumption world economic growth of 3% pa max on a sustainable basis • European growth to be constrained not only by lack of competitiveness but also slow take up of technologies such as GM, nuclear and shale
Is the economic growth from the emerging economies additional? Douglas McWilliams, Mercers’ School Memorial Professor of Commerce at Gresham College and Chief Executive of Cebr Thras Moraitis, Member of Executive Board Xstrata plc and Michael McWilliams, Global head of Hydro, Mott MacDonald