Download
1 / 69
690 likes | 822 Views
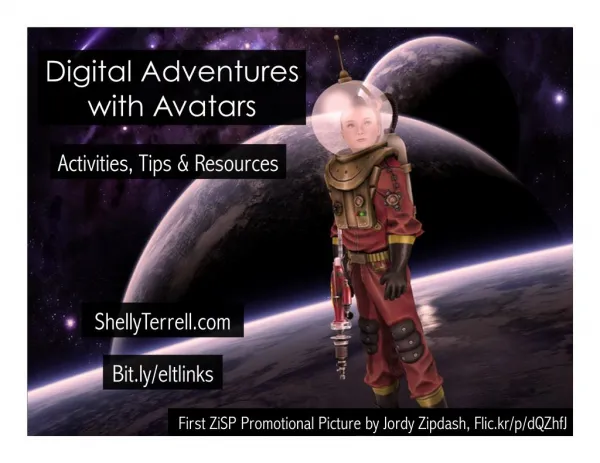
Agents and Avatars: A New Era of Computational Social Science. Michael Macy Cornell University. Challenges and Visions in the Social Sciences, ETH Zurich, August 18, 2008. Acknowledgements. Members of the Cornell cybertools team National Science Foundation Brewster Kahle, Internet Archive

E N D
Agents and Avatars: A New Era of Computational Social Science Michael Macy Cornell University Challenges and Visions in the Social Sciences, ETH Zurich, August 18, 2008
Acknowledgements Members of the Cornell cybertools team National Science Foundation Brewster Kahle, Internet Archive Tim Clark, DARPA Cornell Institute for the Social Sciences
Social life is more like improv jazz than an orchestra • How is this possible with • millions of players? • each aware only of local “neighbors”?
Outline • Part 1: A Paradigm Shift in Social Science? • Part 2: Research Projects • How does network structure affect social behavior? • What causes network ties to form and break?
Part 1 How Digital Traces are Transforming Social Science
“Old School” Social Science • Interactions among variables, not individuals • Correlations, no causal mechanisms • Population of individuals – no local structure • Observations are independent – no influence • Problem is conceptual, not methodological • "These regression equations are the 'laws' of a science” (Blalock 1960:275) • Abbott: “General Linear Reality”
Variables Interact, Not People -.08 JOB SAT AGE .28 .58 AUTO- NOMY .47 .57 Bryman and Cramer (1990)Quantitative Data Analysis for Social Scientists, pp. 246-251 $
A Hopfield Model of Opinion Dynamics* • Agents belong to one of two ethnic groups • All opinions are binary (for or against) • Homophily + Xenophobia • Two experimental manipulations: • Attraction increases influence vs. no influence • Random start, except ethnicity biases initial opinions with probability p = [0, 0.1, 0.2] • Run until equilibrium (population polarizes) • Compare OLS estimates with “ground truth” across conditions. *with Andreas Flache (Groningen)
From Factors to Actors • What we really want to know about are the interactions among people, not variables. • How we influence network neighbors in response to local influence received • How network structure affects propagation of influence • How attributes of actors affect tie formation
Problem: Social Life is Hard to See • You can interview friends, but you cannot interview a friendship. • Fleeting interaction • In private • Tedious to record over time, especially in large groups
Why This is Changing • Humans increasingly interact online • Publicly in Web pages, Facebook, blogs, news groups, wikis, MMOGs, Second Life, eBay, epinions, LastFM, flickr • Privately in email, SMS, Facebook, phones • Computer-mediated interaction leaves digital traces
New Era of Computational Social Science • How local micro interaction generates macrosocial patterns • Agent-based computational models • Relations among actors, not attributes • Out of equilibrium dynamics • Network evolves as it constrains • On-line controlled X-cultural experiments • Digital traces of on-line interactions
Cover Story in Science “Online virtual worlds, electronic environments where people can work and interact in a somewhat realistic manner, have great potential as sites for research in the social, behavioral, and economic sciences … Second Life and World of Warcraft … foreshadow future developments, introducing a number of research methodologies that scientists are now exploring, including formal experimentation, observational ethnography, and quantitative analysis of economic markets or social networks.” --William Sims Bainbridge “The Scientific Research Potential of Virtual Worlds” Science, 27 July 2007
Cover Story in Science “Online virtual worlds, electronic environments where people can work and interact in a somewhat realistic manner, have great potential as sites for research in the social, behavioral, and economic sciences … Second Life and World of Warcraft … foreshadow future developments, introducing a number of research methodologies that scientists are now exploring, including formal experimentation, observational ethnography, and quantitative analysis of economic markets or social networks.” --William Sims Bainbridge “The Scientific Research Potential of Virtual Worlds” Science, 27 July 2007
But is this the “Real World”? • When humans interact via digital devices, do they enter a parallel universe? • Historically unique • User-generated identities (aka “self-presentation”) • Few spatial, cultural, or legal constraints on interaction (may be revealing as well as concealing) • Some community members are silicon life forms • Limited demographic data
The Web is All Too Real • Three incompatible goals: • Automatic data collection of large-scale computer-mediated human social interactions 2. Widest possible access to these data by diverse research teams 3. Protection of privacy
The Web as a Record of Social Interaction The spread of hoaxes, rumors, urban legends Diffusion of innovation (e.g. free/paid hotel wifi) Movement of personnel among organizations Political campaigns Status hierarchies (who links/refers to whom) Opinion dynamics in blogs, newsgroups, product ratings
The Internet Archive • 10 years of bi-monthly crawls • Approaching 2 PB (compressed) • Page content plus metadata (format, links, anchor text, file type (pdf, jpg, flash) • NSF: $2M Cybertools Grant • To copy the Archive to Cornell • Reconfigure it as a searchable database
ETH Website 2 March 1997
Part 2 New Research Opportunities (coming attractions)
I. How Do Ties Matter? How does “six degrees of separation” affect social influence? Is influence more effective in densely clustered neighborhoods? How important are strong vs. weak ties?
It certainly is a small world! That’s amazing you know my Uncle Charlie! A Chance Encounter in a Distant Land Leads to Small Talk…
Six Degrees of Separation The planet is very large: 6.5b! Yet the world is small: 6˚ How is this possible?
Adding to the Mystery… B A Easy to explain if the social ties were random But friendships tend to be highly clustered C
Solved by Watts & Strogatz • While preserving the clustering of a social network • A few long-range ties • Create “shortcuts” between otherwise distant nodes
Granovetter: Strength of Weak Ties • Social ties vary in strength • Frequency of interaction • Trust, commitment, attachment • Strong ties form short cycles • Strength of weak ties is their range
Does Tie Strength Decline with Range?* 3 2 4 1 5 Range=6 6 • Tie strength • Number of emails, phone calls • Email lag times • Duration of phone calls Range is the path length traversed *with Gueorgi Kossinets (Cornell), Nathan Eagle (MIT/SFI)
Range Compensates for Weakness “Whatever is to be diffused can reach a larger number of people, and traverse a greater social distance, when passed through weak ties rather than strong.”-- Mark Granovetter, 1973 Access/exposure to new ideas and information A truism across the social & information sciences But there are some intriguing anomalies...
The Chain-Letter Paradox* Sequence of signatures on e-mail chain letter protesting the Iraq war, with 18,119 nodes, median length is 288. If most people are separated by only six degrees, why are e-mail chain letters hundreds of links long? *Liben-Nowell & Kleinberg 2008, “Tracing information flow on a global scale using Internet chain-letter data,” PNAS 105:4633-38.
The Triangle Paradox McAdams: People recruit their friends to social movements and communities Well documented that the probability of recruitment increase with the number of friends who are already members. A new study discovered something odd…
Friendship and Diffusion* • All BT residential landlines in the UK • Individuals one degree removed (non-adopters with at least one adopter tie) • What is the probability of adopting BT Voice Mail as a function of • Number of friends who already adopted • Clustering among friends *With Nathan Eagle (MIT, SFI).
Number and clustering of friends A B C Time 1
Number and clustering of friends A B C Time 2
Number and clustering of friends A B C Time 3
Number and clustering of friends A B C Time 4
Number and clustering of friends A B C Time 5
Number and clustering of friends A B C Time 6
Number and clustering of friends A B C Time 7
Number and clustering of friends A B C Time 8
Why Do Triangles Matter? • Or effect of coordinated influence? • A proxy for tie strength? B B A A C C
Why is Clustering Important? Why do chain-letters seem to avoid taking “shortcuts” across the network? Why is it the mutual friends that diffuse an innovation?
A Simple Explanation* • Long-range ties inform but do not persuade • Acquiring information ≠ acting on it • Credibility, legitimacy increase with prior adopters • The same information from two friends is redundant • The same advice from two friends is not • Maybe it’s not such a small world after all? • Centola, D. and M. Macy. 2007. “Complex Contagions & the Weakness of Long Ties.” American Journal of Sociology 113:702-34
Illustrates the width of the bridge between the neighborhoods of i (black and gray/black nodes) and l(gray and gray/black nodes), showing the two common members (gray/black nodes). The bridge between these two neighborhoods consists of the three ties jl, kl, and km (shown as bold lines).
Illustrates the width of the bridge between the neighborhoods of i (black and gray/black nodes) and l(gray and gray/black nodes), showing the two common members (gray/black nodes). The bridge between these two neighborhoods consists of the three ties jl, kl, and km (shown as bold lines).
Illustrates the width of the bridge between the neighborhoods of i (black and gray/black nodes) and l(gray and gray/black nodes), showing the two common members (gray/black nodes). The bridge between these two neighborhoods consists of the three ties jl, kl, and km (shown as bold lines).