Download
1 / 1
10 likes | 113 Views
Satellite and Field Derived Aboveground Carbon Stock in Tropical Regions.

E N D
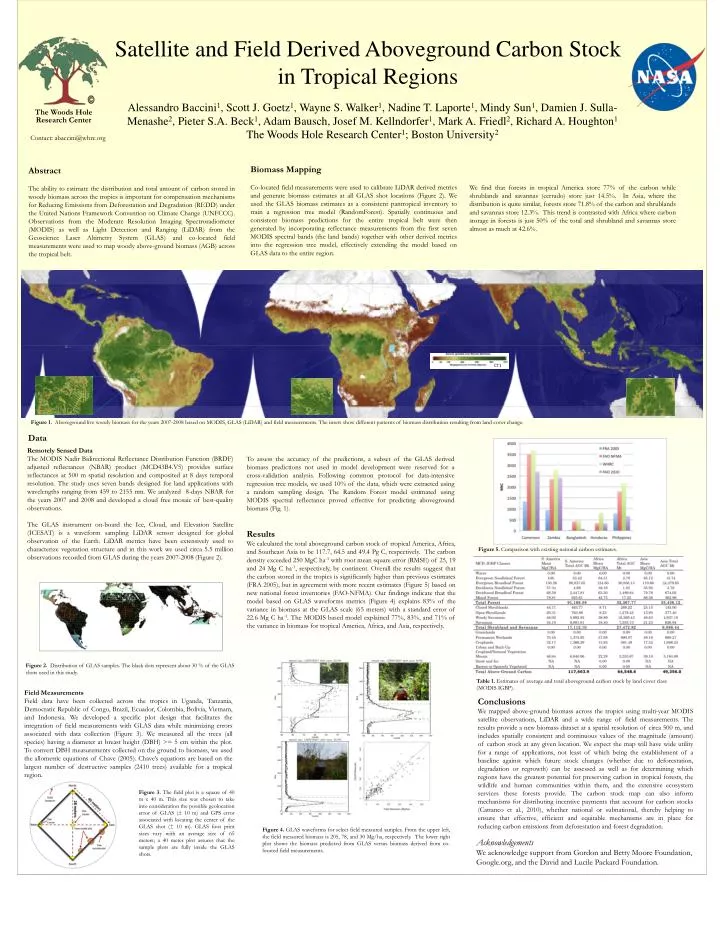
Satellite and Field Derived Aboveground Carbon Stock in Tropical Regions Alessandro Baccini1, Scott J. Goetz1, Wayne S. Walker1, Nadine T. Laporte1, Mindy Sun1, Damien J. Sulla-Menashe2, Pieter S.A. Beck1, Adam Bausch, Josef M. Kellndorfer1, Mark A. Friedl2, Richard A. Houghton1 The Woods Hole Research Center1; Boston University2 The Woods Hole Research Center Contact: abaccini@whrc.org Biomass Mapping Co-located field measurements were used to calibrate LiDAR derived metrics and generate biomass estimates at all GLAS shot locations (Figure 2). We used the GLAS biomass estimates as a consistent pantropical inventory to train a regression tree model (RandomForest). Spatially continuous and consistent biomass predictions for the entire tropical belt were then generated by incorporating reflectance measurements from the first seven MODIS spectral bands (the land bands) together with other derived metrics into the regression tree model, effectively extending the model based on GLAS data to the entire region. Abstract The ability to estimate the distribution and total amount of carbon stored in woody biomass across the tropics is important for compensation mechanisms for Reducing Emissions from Deforestation and Degradation (REDD) under the United Nations Framework Convention on Climate Change (UNFCCC).Observations from the Moderate Resolution Imaging Spectroradiometer (MODIS) as well as Light Detection and Ranging (LiDAR) from the Geoscience Laser Altimetry System (GLAS) and co-located field measurements were used to map woody above-ground biomass (AGB) across the tropical belt. We find that forests in tropical America store 77% of the carbon while shrublands and savannas (cerrado) store just 14.5%. In Asia, where the distribution is quite similar, forests store 71.8% of the carbon and shrublands and savannas store 12.3%. This trend is contrasted with Africa where carbon storage in forests is just 50% of the total and shrubland and savannas store almost as much at 42.6%. Figure 1. Aboveground live woody biomass for the years 2007-2008 based on MODIS, GLAS (LiDAR) and field measurements. The insets show different patterns of biomass distribution resulting from land cover change. Data Remotely Sensed Data The MODIS Nadir Bidirectional Reflectance Distribution Function (BRDF) adjusted reflectances (NBAR) product (MCD43B4.V5) provides surface reflectances at 500 m spatial resolution and composited at 8 days temporal resolution. The study uses seven bands designed for land applications with wavelengths ranging from 459 to 2155 nm. We analyzed 8-days NBAR for the years 2007 and 2008 and developed a cloud free mosaic of best-quality observations. The GLAS instrument on-board the Ice, Cloud, and Elevation Satellite (ICESAT) is a waveform sampling LiDAR sensor designed for global observation of the Earth. LiDAR metrics have been extensively used to characterize vegetation structure and in this work we used circa 5.5 million observations recorded from GLAS during the years 2007-2008 (Figure 2). To assess the accuracy of the predictions, a subset of the GLAS derived biomass predictions not used in model development were reserved for a cross-validation analysis. Following common protocol for data-intensive regression tree models, we used 10% of the data, which were extracted using a random sampling design.The Random Forest model estimated using MODIS spectral reflectance proved effective for predicting aboveground biomass (Fig. 1). Results We calculated the total aboveground carbon stock of tropical America, Africa, and Southeast Asia to be 117.7, 64.5 and 49.4 Pg C, respectively. The carbon density exceeded 250 MgC ha-1 with root mean square error (RMSE) of 25, 19 and 24 Mg C ha-1, respectively, by continent. Overall the results suggest that the carbon stored in the tropics is significantly higher than previous estimates (FRA 2005), but in agreement with more recent estimates (Figure 5) based on new national forest inventories (FAO-NFMA). Our findings indicate that the model based on GLAS waveforms metrics (Figure 4) explains 83% of the variance in biomass at the GLAS scale (65 meters) with a standard error of 22.6 Mg C ha-1. The MODIS based model explained 77%, 83%, and 71% of the variance in biomass for tropical America, Africa, and Asia, respectively. Figure 5. Comparison with existing national carbon estimates. Figure 2. Distribution of GLAS samples. The black dots represent about 30 % of the GLAS shots used in this study. Table 1. Estimates of average and total aboveground carbon stock by land cover class (MODIS IGBP). Field Measurements Field data have been collected across the tropics in Uganda, Tanzania, Democratic Republic of Congo, Brazil, Ecuador, Colombia, Bolivia, Vietnam, and Indonesia. We developed a specific plot design that facilitates the integration of field measurements with GLAS data while minimizing errors associated with data collection (Figure 3). We measured all the trees (all species) having a diameter at breast height (DBH) >= 5 cm within the plot. To convert DBH measurements collected on the ground to biomass, we used the allometric equations of Chave (2005). Chave’s equations are based on the largest number of destructive samples (2410 trees) available for a tropical region. Conclusions We mapped above-ground biomass across the tropics using multi-year MODIS satellite observations, LiDAR and a wide range of field measurements. The results provide a new biomass dataset at a spatial resolution of circa 500 m, and includes spatially consistent and continuous values of the magnitude (amount) of carbon stock at any given location. We expect the map will have wide utility for a range of applications, not least of which being the establishment of a baseline against which future stock changes (whether due to deforestation, degradation or regrowth) can be assessed as well as for determining which regions have the greatest potential for preserving carbon in tropical forests, the wildlife and human communities within them, and the extensive ecosystem services these forests provide. The carbon stock map can also inform mechanisms for distributing incentive payments that account for carbon stocks (Cattaneo et al., 2010), whether national or subnational, thereby helping to ensure that effective, efficient and equitable mechanisms are in place for reducing carbon emissions from deforestation and forest degradation. Figure 3. The field plot is a square of 40 m x 40 m. This size was chosen to take into consideration the possible geolocation error of GLAS (± 10 m) and GPS error associated with locating the center of the GLAS shot (± 10 m). GLAS foot print sizes vary with an average size of 65 meters; a 40 meter plot assures that the sample plots are fully inside the GLAS shots. Figure 4. GLAS waveforms for select field measured samples. From the upper left, the field measured biomass is 205, 78, and 30 Mg/ha, respectively. The lower right plot shows the biomass predicted from GLAS versus biomass derived from co-located field measurements. Acknowledgements We acknowledge support from Gordon and Betty Moore Foundation, Google.org, and the David and Lucile Packard Foundation.