Download
1 / 39
400 likes | 763 Views
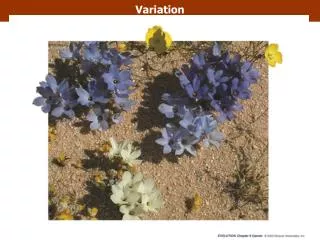
Variation. 9.1 Phenotypic variation caused by genetic differences and by the environment. Genetic variation is the foundation of evolution Understanding the process of evolution requires understanding of the origin and transmutation of genetic variation Phenotype, genotype, locus, allele

E N D
9.1 Phenotypic variation caused by genetic differences and by the environment • Genetic variation is the foundation of evolution • Understanding the process of evolution requires understanding of the origin and transmutation of genetic variation • Phenotype, genotype, locus, allele • Phenotypic variation can be caused by genetic differences and by the environment
9.1 Phenotypic variation caused by genetic differences and by the environment
9.2 Multiple alleles underlie some genetic variation • In some cases, three or more alleles exist within a population • Papilio dardanus • Cepaea nemoralis • Homo sapiens
9.2 Multiple alleles underlie some genetic variation • Individuals may differ in phenotype due to environmental conditions • Identical twins • Learning • Maternal effects • Genetic and non-genetic sources of phenotypic variation may be disentangled through: crossing experiments, studies of heritability, common garden experiments
9.3 The frequency of three genotypes among females and males in one generation
9.4(1) A hypothetical example illustrating attainment of Hardy-Weinberg genotype frequencies
9.4(2) A hypothetical example illustrating attainment of Hardy-Weinberg genotype frequencies
9.4(3) A hypothetical example illustrating attainment of Hardy-Weinberg genotype frequencies
9.4(3) A hypothetical example illustrating attainment of Hardy-Weinberg genotype frequencies • Hardy-Weinberg principle is foundation on which most of the genetic theory of evolution rests • Genotypic frequencies attain their H-W values after a single generation of random mating • Not only genotype frequencies, but also allele frequencies, remain unchanged from generation to generation • Critical assumptions: random mating, large population, no gene flow, no mutation, no natural selection • Segregation distortion or meiotic drive
9.5 Hardy-Weinberg genotype frequencies as a function of allele frequencies at a locus with 2 alleles
9.6 Genotype frequencies in a the wild oat compared with those expected under Hardy-Weinberg • One form of nonrandom mating is inbreeding, i.e. the tendency to mate with relatives • Gene copies are identical by descent if they have descended, by replication, from a common ancestor, relative to other gene copies in the population
9.6 Genotype frequencies in a the wild oat compared with those expected under Hardy-Weinberg • One form of nonrandom mating is inbreeding, i.e. the tendency to mate with relatives • Gene copies are identical by descent if they have descended, by replication, from a common ancestor, relative to other gene copies in the population • H = H0(1-F) where H0 is the heterozygote frequency expected if the locus were in H-W equilibrium, and F is the inbreeding coefficient
9.6 Genotype frequencies in a the wild oat compared with those expected under Hardy-Weinberg • Genotype frequencies at a locus with allele frequencies p=0.4 and q=0.6 when mating is random (F=0) and when the population is partially inbred (F=0.5) • F = (H0-H)/H0 ; reflects reduction in heterozygosity compared to a panmictic population with equal allele frequencies
9.6 Genotype frequencies in wild oat compared with those expected under Hardy-Weinberg
9.10 Inbreeding depression in humans • Phenomenon is well known in human populations • The more closely related the parents, the higher the mortality rate among their offspring (data of offspring up to 21 years of age from marriages registered in 1903-1907 in Italian populations)
9.11 The golden lion tamarin is a small, highly endangered Brazilian monkey • Known problem in small, captive-bred populations • Golden lion tamarin (Leontopithecus rosalia); 500 ind in 140 zoos • Breeding scheme based on outbreeding
9.12 Population decline and increase in an inbred population of adders in Sweden • Isolated populations with less than 40 individuals • High levels of inbreeding caused small litter sizes and high juvenile mortality
9.13 Genetic variation in the enzyme phosphoglucomutase among 18 individual killifishes • To assess the evolutionairy potential of a population, one needs to quantify the degree of genetic variation • One therefore needs to know the fraction of polymorphic loci, the number of alleles per locus and their relative frequencies • Electrophoretic gel showing genetic variation in the enzyme phosphoglucomutase among 18 individual Killifishes (Fundulus zebrinus)
9.14 Nucleotide variation at the Adh locus in Drosophila melanogaster • Nucleotide variation at the Adh locus in Drosophila melanogaster • First study of genetic variation by means of complete DNA sequencing (Drosophila melanogaster) dates from 1983 • Nucleotide diversity per site (∏) reflects the proportion of nucleotide sites at which two gene copies randomly taken from a population, differ
9.15(1) The decay of linkage disequilibrium between two unlinked loci over three generations • Each gene is linked to certain other genes • Changes in allele frequencies at one locus may cause correlated changes at other, linked loci • Linkage disequilibrium refers to the association between certain alleles at different loci • Recombination between meiosis reduces the level of linkage disequilibrium
9.15(1) The decay of linkage disequilibrium between two unlinked loci over three generations • Each gene is linked to certain other genes • Changes in allele frequencies at one locus may cause correlated changes at other, linked loci • Linkage disequilibrium refers to the association between certain alleles at different loci • Recombination between meiosis reduces the level of linkage disequilibrium
9.15(1) The decay of linkage disequilibrium between two unlinked loci over three generations • Each gene is linked to certain other genes • Changes in allele frequencies at one locus may cause correlated changes at other, linked loci • Linkage disequilibrium refers to the association between certain alleles at different loci • Recombination between meiosis reduces the level of linkage disequilibrium
9.15(1) Variation in quantitative traits • Discrete genetic polymorphisms in phenotypic traits are much less common than slight differences among individuals (continuous, metric or quantitative variation) • Distributions of these traits often approach normality, and the genetic component of such variation is polygenic
9.17 The frequency distribution of the number of dermal ridges in a sample of 825 British men • Discrete genetic polymorphisms in phenotypic traits are much less common than slight differences among individuals (continuous, metric or quantitative variation) • Distributions of these traits often approach normality, and the genetic component of such variation is polygenic
9.18(1) An example of genotype environment interaction • A norm of reaction quantifies the variety of different phenotypic states that can be produced by a single genotype under different environmental conditions • Genotype x environment interaction on the number of bristles on the abdomen of male Drosophila pseudoobscura • Degree of phenotypic variation due to genetic differences between individuals depends on environmental conditions
9.18(1) An example of genotype environment interaction • A norm of reaction quantifies the variety of different phenotypic states that can be produced by a single genotype under different environmental conditions • Genotype x environment interaction on the number of bristles on the abdomen of male Drosophila pseudoobscura • Degree of phenotypic variation due to genetic differences between individuals depends on environmental conditions
9.18(1) An example of genotype environment interaction • A norm of reaction quantifies the variety of different phenotypic states that can be produced by a single genotype under different environmental conditions • Genotype x environment interaction on the number of bristles on the abdomen of male Drosophila pseudoobscura • Degree of phenotypic variation due to genetic differences between individuals depends on environmental conditions
9.19 Variation in a quantitative trait, such as body length • Analysis of quantitative variation is based on statistical analysis • Variance refers to distribution of values around mean • VP = VG + VE • h² = VG/(VG + VE)
9.20(1) The relationship between the phenotypes of offspring and parents • Heritabilities can be estimated through regression of offspring means on midparent means, or between other individuals with known relatedness • A regression coefficient of 1 indicates a very strong genetic basis • Often, heritability studies involve common garden experiments
9.20(1) The relationship between the phenotypes of offspring and parents • Heritabilities can be estimated through regression of offspring means on midparent means, or between other individuals with known relatedness • A regression coefficient of 1 indicates a very strong genetic basis • Often, heritability studies involve common garden experiments
9.21 Selection for movement in response to light in Drosophila pseudoobscura • Artificial selection can only act on the genetic component of phenotypic variation • It differs from natural selection in the way that reproductive success strongly depends on one (or a limited number of) trait(s) selected by the scientist • Selection for movement in response to light in Drosophila pseudoobscura
9.28 Gene flow causes populations to converge in allele frequencies • Only rarely populations are strictly isolated from each other; most often they show some degree of gene flow • Isolation-by-distance model • Gene flow (m) reflects the proportion of gene copies per generation that are derived from immigrants • Gene flow causes convergence in allele frequencies
9.30(1) Genetic differentiation among populations of the North American pitcher-plant mosquito • Variation in allele frequencies among populations can be quantified in different ways • FST = Vq/(q)(1-q) with FSTvarying between 0 (no variation among populations) and 1 (populations fixed for different alleles) • GST can be computed for a locus with more than 2 alleles • Genetic differentiation among populations of the North American pitcher-plant mosquito
9.30(1) Genetic differentiation among populations of the North American pitcher-plant mosquito • Genetic differentiation can also be expressed by Nei’s index of genetic distance (Nei 1987) • Expresses the probability that two gene copies from two populations comprise different allelic variants • Often visualized by means of phenograms (clustering algorithm)
9.30(2) Genetic differentiation among populations of the North American pitcher-plant mosquito
9.31 Geographic variation in mitochondrial DNA in MacGillivray’s warbler • DNA sequences may also provide information re. genealogic (phylogenetic) relationships between alleles • Allows reconstruction of the evolutionary history of species • Geographic variation in mitochondrial DNA in MacGillivray’s warbler
9.32(1) A division of the world’s human populations into eight classes of genetic similarity • Homo sapiens comprises one single biological species • Some studies discriminate between 3-60 races • Patterns of genetic variation strongly differ in relation to racial subdivision • Genetic similarity classes (enzymes and blood group loci)
9.32(2) The geographic distribution of skin color • Homo sapiens comprises one single biological species • Some studies discriminate between 3-60 races • Patterns of genetic variation strongly differ in relation to racial subdivision • Genetic similarity classes (enzymes and blood group loci)