Download
1 / 26
260 likes | 469 Views
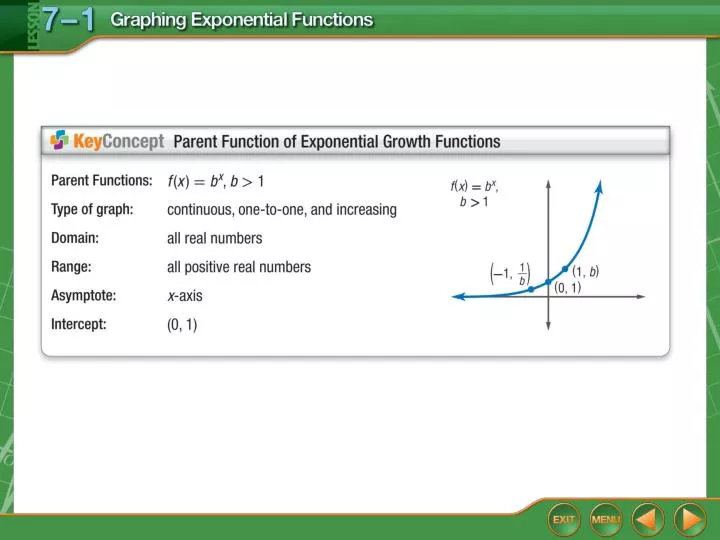
Concept. Graph Exponential Growth Functions. Graph y = 4 x . State the domain and range. Make a table of values. Connect the points to sketch a smooth curve. Example 1. Graph Exponential Growth Functions. Answer:. The domain is all real numbers, and the range is all positive real numbers.

E N D
Graph Exponential Growth Functions Graph y = 4x. State the domain and range. Make a table of values. Connect the points to sketch a smooth curve. Example 1
Graph Exponential Growth Functions Answer: The domain is all real numbers, and the range is all positive real numbers. Example 1
A.B. C.D. Which is the graph of y = 3x? Example 1
Graph Transformations A. Graph the function y = 3x – 2. State the domain and range. The equation represents a translation of the graphy = 3x down 2 units. Example 2A
Graph Transformations Answer: Domain = {all real numbers} Range = {y│y > –2} Example 2A
Graph Transformations B. Graph the function y = 2x – 1. State the domain and range. The equation represents a translation of the graphy = 2x right 1 unit. Example 2B
Graph Transformations Answer: Domain = {all real numbers} Range = {y │y ≥ 0} Example 2B
A.B. C.D. A. Graph the function y = 2x – 4. Example 2A
A.B. C.D. B. Graph the function y = 4x – 2+ 3. Example 2B
Graph Exponential Growth Functions INTERNETIn 2006, there were 1,020,000,000 people worldwide using the Internet. At that time, the number of users was growing by 19.5% annually. Draw a graph showing how the number of users would grow from 2006 to 2016 if that rate continued. First, write an equation using a = 1.020 (in billions), and r = 0.195. y = 1.020(1.195)t Then graph the equation. Example 3
Graph Exponential Growth Functions Answer: Example 3
A.B. C.D. CELLULAR PHONESIn 2006, there were about 2,000,000,000 people worldwide using cellular phones. At that time, the number of users was growing by 11% annually. Which graph shows how the number of users would grow from 2006 to 2014 if that rate continued? Example 3
A. Graph the function State the domain and range. Graph Exponential Decay Functions Example 4A
Graph Exponential Decay Functions Answer: Domain = {all real numbers} Range = {y│y > 0} Example 4A
B. Graph the function State the domain and range. The equation represents a transformation of the graph of Graph Exponential Decay Functions Examine each parameter. ● There is a negative sign in front of the function: The graph is reflected in the x-axis. ● a = 4: The graph is stretched vertically. Example 4B
Graph Exponential Decay Functions ● h = 1: The graph is translated 1 unit right. ● k = 2: The graph is translated 2 units up. Answer: Domain = {all real numbers} Range = {y│y < 2} Example 4B
A. Graph the function A.B. C.D. Example 4A
B. Graph the function A.B. C.D. Example 4B
Graph Exponential Decay Functions A. AIR PRESSUREThe pressure of the atmosphere is 14.7 lb/in2 at Earth’s surface. It decreases by about 20% for each mile of altitude up to about 50 miles. Draw a graph to represent atmospheric pressure for altitude from 0 to 20 miles. y = a(1 – r)t = 14.7(1 – 0.20)t = 14.7(0.80)t Example 5A
Graph Exponential Decay Functions Graph the equation. Answer: Example 5A
Graph Exponential Decay Functions B. AIR PRESSUREThe pressure of the atmosphere is 14.7 lb/in2 at Earth’s surface. It decreases by about 20% for each mile of altitude up to about 50 miles. Estimate the atmospheric pressure at an altitude of 10 miles. y = 14.7(0.80)t Equation from part a. = 14.7(0.80)10 Replace t with 10. ≈ 1.58 lb/in2 Use a calculator. Answer: The atmospheric pressure at an altitude of about 10 miles will be approximately 1.6 lb/in2. Example 5B
A.B. C.D. A. AIR PRESSUREThe pressure of a car tire with a bent rim is 34.7 lb/in2 at the start of a road trip. It decreases by about 3% for each mile driven due to a leaky seal. Draw a graph to represent the air pressure for a trip from 0 to 40 miles. Example 5A
B. AIR PRESSUREThe pressure of a car tire with a bent rim is 34.7 lb/in2 at the start of a road trip. It decreases by about 3% for each mile driven due to a leaky seal. Estimate the air pressure of the tire after 20 miles. A. 15.71 lb/in2 B. 16.37 lb/in2 C. 17.43 lb/in2 D. 18.87 lb/in2 Example 5B