Download
1 / 17
170 likes | 309 Views
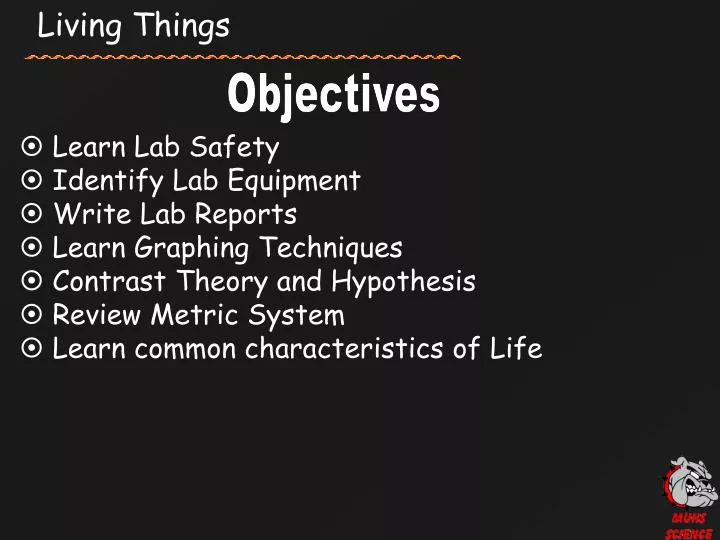
Objectives. Learn Lab Safety Identify Lab Equipment Write Lab Reports Learn Graphing Techniques Contrast Theory and Hypothesis Review Metric System Learn common characteristics of Life. Living Things. A. Graphing Techniques. Types of Graphs: BAR GRAPH.

E N D
Objectives • Learn Lab Safety • Identify Lab Equipment • Write Lab Reports • Learn Graphing Techniques • Contrast Theory and Hypothesis • Review Metric System • Learn common characteristics of Life Living Things
A. Graphing Techniques Types of Graphs: BAR GRAPH • Use for “chunking” or ________ data • Show trends and ____________ • Does NOT allow ____________comparisons Grouping Compare Sizes Cause and effect
Use for displaying __________ Does NOT allow ________________ comparisons A. Graphing Techniques Types of Graphs: CIRCLE OR PIE GRAPH Percentages cause and effect
A. Graphing Techniques Types of Graphs: LINE GRAPH (scatter plot) • Used most often in ________ • Independent/ • Dependent Variable Comparison _______________ Science Cause and effect
A. Graphing Techniques TWO VARIABLES WITH DIFFERENT SCALES
A. Graphing Techniques: Cause and Effect Just because you can graph two things does not mean one _________ the other Causes What can you say about this? Thing 2 Number of Murders Thing 1 Ice cream sales
A. Graphing Techniques: Remember • X is across, Y is up high • Independent = manipulated (cause) • Dependent = responding (effect) • Label x and y axis, title the graph • When time is a variable, it always appears on the X-Axis (Time is the ultimate independent variable; time waits for no one!)
B. Metric System meter liter gram u = K H D u d c m ing ector oesn’t sually rink hocolate ilk
B. Metric System – Sample Problems 1000g = ________ Kg 0.043 m = ___________ cm 0.23 Dg =________ g 15.25 cL = ___________ KL 345 m = ________ Km 101.34 Km = __________ mm 32 Dg = ________ mg 1.5 DL = ____________ KL 3.43 Hm = _______ dm 0.476 mL = _________ cL
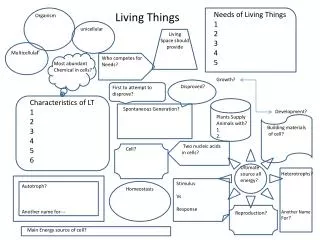
C. Studying Life What distinguishes a living thing from a non-living thing? The study of living things is called _____________ Biology
A. What is Life? There are 8 characteristics of living things. Living things: 1. are made of basic units called cells. 2. are based on a common genetic code. Generally: DNA 3. obtain and use materials and energy.
A. What is Life? 4. grow and develop. 5. reproduce. 6. respond to their environment. 7. maintain a stable internal environment (homeostasis) 8. taken as a group, change over time (evolve)