Download

1 / 54
550 likes | 804 Views
Chapter 5 Validity and Reliability. Social Epidemiology 3673-01. Measurement Issues Bimodal distributions - Dead or alive, male or female, tuberculin reactions, etc. Unimodal distributions - Blood pressure, body mass index, etc. Terminology: - 1.Validity: accuracy

E N D
Chapter 5Validity and Reliability Social Epidemiology 3673-01
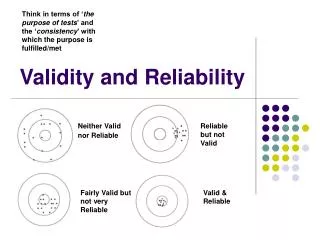
Measurement Issues • Bimodal distributions - Dead or alive, male or female, tuberculin reactions, etc. • Unimodal distributions - Blood pressure, body mass index, etc. • Terminology: - 1.Validity: accuracy * How closely does a measurement represent the truth? - 2. Reliability: reproducibility, repeatability, precision * How closely do repeated measurements agree?
Accurate Unreliable Inaccurate Reliable x x x x x x x X X x x x x x x x x x x x x Inaccurate Unreliable Accurate Reliable x X x x X x x x x x x x x x x x
Accuracy, Validity • An accurate measure allows us to categorize people correctly • Two components: - Sensitivity * Ability to correctly identify those who are sick (true positives on a test) - Specificity * Ability to correctly identify those who are NOT sick (true negatives on a test)
Tests with Dichotomous Results (Positive or Negative)
Set up of a 2×2 table (Variable 1) Reality (or our very best guess at it) (Variable 2) Results of test Disease No disease TOTAL Positive a b a+b Negative c d c+d TOTAL a+c b+d a+b+c+d
Formula • Sensitivity=a/a+c,percentage of the truly diseased individuals that were correctly detected as positive in the test • Specificity=d/b+d,percentage of the truly not diseased individuals that were correctly detected as negative in the test
Sensitivity and Specificity True Characteristics of Population Disease No Disease Test Results 180 Positive 820 Negative 1,000 100 900 Sensitivity – of all the people who are sick who was correctly identified: 80/100 = 80% Specificity – of all the people who are not sick who was correctly identified: 800/900 = 89% Table 5-1 p 87
Example Breast cancer confirmed by biopsy Results of mammogram Cancer No cancer TOTAL Positive 132 983 1,115 Negative 45 63,650 63,695 TOTAL 177 64,633 64,810 Sensitivity=? Specificity=?
Example Breast cancer confirmed by biopsy Results of mammogram Cancer No cancer TOTAL Positive 132 983 1,115 Negative 45 63,650 63,695 TOTAL 177 64,633 64,810 Sensitivity = 132/177 = 74.58% Specificity= 63650/64633 = 98.48%
Tests with Continuous Variables: • A decision must be made in establishing a cutoff level above which a test result is considered positive and below which a result is considered negative (e.g., blood pressure; blood glucose level). • There is a trade-off between sensitivity and specificity in setting the cutoff level. • The choice of the cutoff level depends on the importance we attach to false positives and false negatives.
Non-Diabetics Non-Diabetics Diabetics Diabetics 17 5 2 14 VS. 3 15 6 18 20 20 20 20 + Screening for Diabetes High cutoff level Low cutoff level + - -
Non-Diabetics Non-Diabetics Diabetics Diabetics 5 17 14 2 VS. 3 15 6 18 20 20 20 20 + Screening for Diabetes High cutoff level Low cutoff level + - - SE=5/20=25% SP=18/20=90% (many false negatives) SE=17/20=85% SP=6/20=30% (many false positives)
Use of Multiple Tests • Sequential (Two-stage) Testing - Stage 1 (less invasive, less expensive) and stage 2 (more invasive, more uncomfortable, more accurate) - Purpose is to reduce the problem of false positives (gain in specificity). - There is a net loss in sensitivity (unless the sensitivity of test 2 is 100%) • Simultaneous Testing (Figure 5-9) - Net sensitivity: Determine how many people got positive results on test A (not B), test B (not A), or both tests - Net specificity: Determine how many people got negative results on both test A and test B. - There is a net loss in specificity (unless the specificity of one of the tests is 100%).
Sequential Testing Test 1 (Blood Sugar) Reality (or our very best guess at it) Results of test Disease (+) No disease (-) TOTAL Positive (+) Negative (-) TOTAL 10,000 Assume: Disease Prevalence = 5%; Population = 10,000; Sensitivity = 70%; Specificity = 80%
Sequential Testing Test 1 (Blood Sugar) Reality (or our very best guess at it) Results of test Disease (+) No disease (-) TOTAL Positive (+) Negative (-) TOTAL 500 9500 10,000 Assume: Disease Prevalence = 5%; Population = 10,000; Sensitivity = 70%; Specificity = 80%
Sequential Testing Test 1 (Blood Sugar) Reality (or our very best guess at it) Results of test Disease (+) No disease (-) TOTAL Positive (+) 350 Negative (-) 150 TOTAL 500 9500 10,000 Assume: Disease Prevalence = 5%; Population = 10,000; Sensitivity = 70%; Specificity = 80%
Sequential Testing Test 1 (Blood Sugar) Reality (or our very best guess at it) Results of test Disease (+) No disease (-) TOTAL Positive (+) 350 1900 Negative (-) 150 7600 TOTAL 500 9500 10,000 Assume: Disease Prevalence = 5%; Population = 10,000; Sensitivity = 70%; Specificity = 80%
Sequential Testing Test 1 (Blood Sugar) Reality (or our very best guess at it) Results of test Disease (+) No disease (-) TOTAL Positive (+) 350 1900 2250 Negative (-) 150 7600 7750 TOTAL 500 9500 10,000 Assume: Disease Prevalence = 5%; Population = 10,000; Sensitivity = 70%; Specificity = 80%
Sequential Testing Test 2 (Glucose Tolerance Test) Reality (or our very best guess at it) Results of test Disease (+) No disease (-) TOTAL Positive (+) Negative (-) TOTAL 350 1900 2,250 Assume: Sensitivity = 90%; Specificity = 90%
Sequential Testing Test 2 (Glucose Tolerance Test) Reality (or our very best guess at it) Results of test Disease (+) No disease (-) TOTAL Positive (+) 315 Negative (-) 35 TOTAL 350 1900 2,250 Assume: Sensitivity = 90%; Specificity = 90%
Sequential Testing Test 2 (Glucose Tolerance Test) Reality (or our very best guess at it) Results of test Disease (+) No disease (-) TOTAL Positive (+) 315 190 505 Negative (-) 35 1710 1745 TOTAL 350 1900 2,250 Assume: Sensitivity = 90%; Specificity = 90%
Sequential Testing Test 2 (Glucose Tolerance Test) Reality (or our very best guess at it) Results of test Disease (+) No disease (-) TOTAL Positive (+) 315 190 505 Negative (-) 35 1710 1745 TOTAL 350 1900 2,250 Assume: Sensitivity = 90%; Specificity = 90%
Net Results (Sequential Testing) Test 1 + Test 2 Reality (or our very best guess at it) Results of test Disease (+) No disease (-) TOTAL Positive (+) 315 190 505 Negative (-) 185 9310 1745 (1710+7600) TOTAL 500 9500 10,000 Net Sensitivity = ? Net Specificity = ?
Simultaneous Testing Test A Reality (or our very best guess at it) Results of test Disease (+) No disease (-) TOTAL Positive (+) 160 320 480 Negative (-) 40 480 520 TOTAL 200 800 1,000 Assume: Sensitivity = 80%; Specificity = 60%
Simultaneous Testing Test B Reality (or our very best guess at it) Results of test Disease (+) No disease (-) TOTAL Positive (+) 180 80 260 Negative (-) 20 720 740 TOTAL 200 800 1,000 Assume: Sensitivity = 90%; Specificity = 90%
Numerator for Net Sensitivity in Simultaneous Testing • A person must be identified as positive by test A, test B, or both tests in order to be considered positive and therefore included in the numerator for net sensitivity for two tests used simultaneously. • Can’t just add the number of persons who tested positive using test A to those who tested positive using test B. • Some people tested positive on both tests
Numerator for Net Sensitivity in Simultaneous Testing • Some people tested positive on both tests • - Test A: 160 true positives • - Test B: among the 160 true positives, test B can identify 160*90%=144 true positives • - Therefore, 144 true positives can be correctly identified by A and B. • - True positives identified only by A: 160-144 = 16 • - True positives identified only by B: 180-144 = 36 • - True positives identified by both A and B: 16+144+36 = 196
Numerator for Net Sensitivity in Simultaneous Testing • Some people tested positive on both tests • - Test B: 180 true positives • - Test A: among the 180 true positives, test A can identify 180*80%=144 true positives • - Therefore, 144 true positives can be correctly identified by A and B. • - Only by A: 160-144 = 16 • - Only by B: 180-144 = 36 • - By both A and B: 16+144+36 = 196 • Then, the net sensitivity of simultaneous testing is 196/200=98% • Net sensitivity goes up in simultaneous testing.
Numerator for Net Specificity in Simultaneous Testing • A person must be identified as negative by both tests in order to be considered negative and therefore included in the numerator for net specificity for two tests used simultaneously.
Numerator for Net Specificity in Simultaneous Testing • - Test A: 480 true negatives • - Test B: among the 480 true negatives identified by A, test B can identify 480*90% = 432 true negatives • - Therefore, 432 is the numerator for net specificity • - Test B: 720 true negatives • - Test A: among the 720 true negatives identified by B, test A can identify 720*60% = 432 true negatives • - Therefore, 432 is the numerator for net specificity • Net specificity=432/800=54% • Net specificity goes down in simultaneous testing.
Net Results (Simultaneous Testing) Test A + Test B Reality (or our very best guess at it) Results of test Disease (+) No disease (-) TOTAL (16+144+36) Positive (+) Negative (-) 196 368 564 436 4 432 TOTAL 200 800 1,000 Net Sensitivity = 196/200 = 98% Net Specificity = 432/800 =54%
Predictive Value of a Test • In a clinical setting, a different question may be important for the physician: If the test results are positive in this patient, what is the probability that this patient has the disease?—this is called the positive predictive value of the test. • If the test result is negative, what is the probability that this patient does not have the disease?—this is called the negative predictive value of the test.
Set up of a 2×2 table Reality (or our very best guess at it) Results of test Disease No disease TOTAL Positive a b a+b Negative c d c+d TOTAL a+c b+d a+b+c+d
Formula PPV=a/a+b,what percentage of the truly diseased were detected as positive in the test NPV=d/c+d,what percentage of the truly not diseased were detected as negative in the test
Example Breast cancer confirmed by biopsy Results of mammogram Cancer No cancer TOTAL Positive 132 983 1,115 Negative 45 63,650 63,695 TOTAL 177 64,633 64,810 PPV=? NPV=?
Example Breast cancer confirmed by biopsy Results of mammogram Cancer No cancer TOTAL Positive 132 983 1,115 Negative 45 63,650 63,695 TOTAL 177 64,633 64,810 PPV=132/1115=11.8% NPV=63650/63695=99.9%
Prevalence + PPV Specificity + Note: These relationships are true for an infrequent disease
Reliability of Tests • Intrasubject variation • Intraobserver variation • Interobserver variation • Overall percent agreement • Kappa statistics • - excellent agreement : > .75 • - intermediate to good agreement: [.40, .75] • - poor agreement: < .40
Kappa Statistics • Interobserver variation • “To what extent do their readings agree beyond what we would expect by chance alone?“ • “To what extent does the agreement between the two observers exceed the level of agreement that would result just from chance?” • KAPPA statistics: (% agreement observed) – (% agreement expected by chance alone) 100% - % agreement expected by chance alone