Download
1 / 21
220 likes | 404 Views
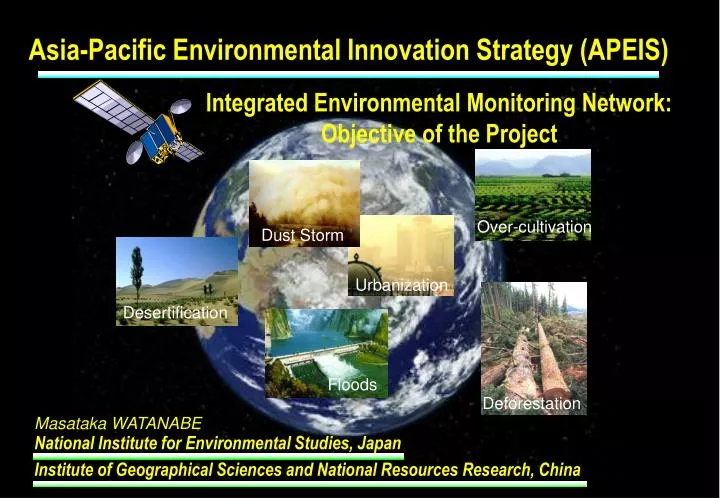
Over-cultivation. Dust Storm. Urbanization. Desertification. Floods. Deforestation. Asia-Pacific Environmental Innovation Strategy (APEIS). Integrated Environmental Monitoring Network: Objective of the Project. Masataka WATANABE. National Institute for Environmental Studies, Japan

E N D
Over-cultivation Dust Storm Urbanization Desertification Floods Deforestation Asia-Pacific Environmental Innovation Strategy (APEIS) Integrated Environmental Monitoring Network: Objective of the Project Masataka WATANABE National Institute for Environmental Studies, Japan Institute of Geographical Sciences and National Resources Research, China
Background and Objectives of APEIS Environmental innovation is a key concept that can help to achieve sustainable development in the Asia-Pacific region. APEIS was proposed at the Environment Congress for Asia and the Pacific (ECO ASIA) in October, 2001, to realize that goal and its launch was endorsed there. • The objectives of APEIS are: • To develop scientific knowledge-based tools andinnovative strategy options • To promote environmental cooperation and capacity building • To propose a model of regional initiatives for sustainable development Integrated Environment Monitoring Sub-project Integrated Environment Assessment Sub-project Research on Strategy Options Sub-project
Objectives of IEM Sub-project ・Development of an integrated environmental monitoring network covering “Asia-Pacific Region” using “MODIS (Moderate Resolution Imaging Spectrometer) sensor” and other satellite data ・Development of “ground-truth network system” ・Development of “ integrated ecosystem model” for environmental evaluation & early-warning - environmental degradation - environmental disasters ・Development of “cooperative research network” among Asia-Pacific region ・Contribution to “environmental decision-making” in Asia-Pacific region
Integrated Monitoring Network System • Satellite Observation NetworkEcological Observation Network Remote-sensing Data (MODIS,LANDSAT, ASTER,SAR,TRMM…) Ground-truth Measurements GIS Data MODELS • Ecological Function Assessment • Integrated Water Management • Carbon Circulation • Ecological Variability • Disaster Protection • Food Production and Security Ecological Indices (Aerosol, Aridity, WDI, FAPR, LAI, NDVI, EVI, NPP… ) Detect of Ecosystem Vulnerability Contribution to Decision Making
Image data transfer Image data transfer Urumqi Urumqi Tsukuba Tsukuba Coverage of MODIS data Beijing Fukang Haibei Taoyuan Yucheng Qianyanzhou APEIS IEM Network System Singapore Singapore Australia NIES-IGSNRR Validation Site MODIS data Receiving and Analyzing Station
Apr-10 Apr-10 Apr-10 Apr-15 Apr-15 Apr-15 Apr-20 Apr-20 Apr-20 Apr-25 Apr-25 Apr-25 Apr-30 Apr-30 Apr-30 May-5 May-5 May-5 Water-Heat-Carbon Fluxes Observed at the Ground Station Network Wheat Field Paddy Field Desertified Land
Dataset Observed at Ground Ecological Stations The project will integrate long-term measurements of water vapor, energy exchange, and carbon dioxide from a variety of ecosystems into consistent, quality-assured, documented datasets. The datasets include the following items: Micrometeorological factors: Solar and net radiation, temperature, humidity, wind, air and vapor pressures, soil temperature and moisture, canopy temperature, precipitation, evaporation, transpiration, etc. Eddy covariance fluxes: Wind in 3 dimensions, sensible and latent heat fluxes, CO2 flux Vegetation characteristics: Species, height, age, density, coverage, leaf area index, photosynthesis Soil characteristics: Physical and chemical properties
Reflectance MODIS Data Processing System Surface Temp. Surface Reflectance Level 0,1 Thermal Anomalies Land Cover/ Land Cover Change Level 2 Land Surface Temperature Vegetation Indices (NDVI & EVI) NDVI Level 3 Albedo16-day L3 Vegetation Cover Conversion Level 4 Leaf Area Index & FPAR Photosynthesis and NPP Leaf Area Index Integrated Model for Land-surface Process, Ecosystem function, and Crop Productivity
Changes in Water Area and Volume of Tongting Lake 09-16, Jan. 2001 01-08, Jan. 2002
Flood around Tongting Lake in the Summer of 2002 Aug. 21-29, 2002 Aug. 21-29, 2001
長江 洞庭湖 雅礱江 ハンヨウ湖 岷江 嘉陵江 沱江 洞庭湖 トートー河 鳥江 漢江 通天河 金沙江 345 620 427 22.3 376 561 3.41 211 38.2 389 27.9 62.0 69.7 長江 4.15 14.2 16.9 17.2 17.0 25.5 ハンヨウ湖 Sand Income in the whole Catchment of Changjiang River (in 1987, Unit:Mton/year) 36.8 2.55 3.63 6.78 0.46
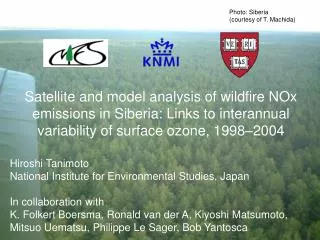
Monitoring Floods SAR Image of Floods Occurred in 1998 in Changjiang River, China
Sand storm in Gansu MODIS Image: Dust Storm Date: 2001/03/20 Effect of Storm in Beijing Monitoring Dust Storm & Air Pollution
Monitoring Dust Storm & Air Pollution Dust storm Dust storm Apr-01-2002 Dust Storm over the Sea of Japan Apr-08-2002 Dust Storm over Eastern Asia
Diagram of the Integrated Ecosystem Model (IEM) Remote-sensing Dataset Parameter Derived Inputs GIS Processing Integrated Models Outputs Water (mm/yr) Evaporation Transpiration Soil Water Runoff Discharge Carbon (Mg/ha/yr) Photosynthesis Respiration Decomposition NPP Nitrogen (kg/ha/yr) Litter fall Mineralization Crop (kg/ha/yr) Potential Productivity Crop Yield Radiation Temperature Humidity Rainfall Wind Climate Land-surface Process Simulator Biome Simulator Water Cycle Simulator Land Unit Extraction Topographical Counter Soil properties Drainage Area Stream Network Biome Type Leaf Area Index Vegetation Crop Growth Simulator Elevation Slope Aspect Topography Texture Depth Water holding capacity Soil Fertilizer Irrigation Technology Management Social- economic
Satellite Remote-sensing Monitoring System ・Flux Tower ・Ground observation system Integrated Ecosystem Model Precipitation Land-surface Process Nitrogen (kg/ha/yr) ・Fertilizer ・N2O Snow & ice Water capacity Water Cycle Forestry Carbon (Mg/ha/yr) ・NPP ・Carbon sink & source ・Biomass Evapotranspiration Surface flow Evaporation Soil moisture Crop Growth Dam Grass Urban Lake & River Ground water Ocean Water (mm/yr) ・Runoff ・Soil moisture ・Water resources ・Flood ・Desertification ・Sand storm ・ GIS database ・Social-economic database ・Soil database ・Nutrient database Crop (kg/ha/yr) ・PotentialProductivity ・Crop Yield