Download
1 / 40
400 likes | 516 Views
Geophysical data management 2004 in JAMSTEC. The comparison of the bathymetric data. INMARETCH2004 Sept. 20th-23rd, 2004 SHINICHI HOSOYA Nippon Marine Enterprises, Ltd. Thankful to : RIE ISHI (NME), MASAYUKI TOIZUMI (NME) TETSUjI MAKI (JAMSTEC), TOSHIO FURUTA (JAMSTEC).

E N D
Geophysical data management 2004 in JAMSTEC The comparison of the bathymetric data INMARETCH2004 Sept. 20th-23rd, 2004 SHINICHI HOSOYA Nippon Marine Enterprises, Ltd Thankful to : RIE ISHI (NME), MASAYUKI TOIZUMI (NME) TETSUjI MAKI (JAMSTEC), TOSHIO FURUTA (JAMSTEC)
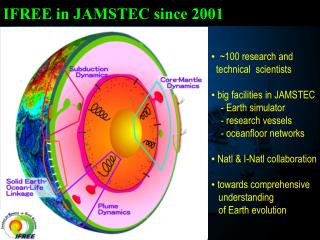
Introduction From the JAMSTEC web page http://www.jamstec.go.jp/
1.Motivation Comparison of Bathymetric maps Table of Contents 2.Theory How to get the data 3.Highlight data How to compare the data 4.Summary and future plan
1.Motivation Bathymetric maps R/V KAIREI SEABEAM R/V NATSUSHIMA SEABAT
2.TheorySynthesis of cross fan-beam Synthesis of cross fan-beams Multi beam prepared by a transmit fan-beam And multiple receive fan-beam
Beam Footprint narrow wide
Block diagram Navigation Processor Interface Recording Mapping Motion Sensor Sound Velocity transceiver On the ship In the water
3.High light data 1)Chose the area from the track line 2)Edit the raw data 3)Average the data 4)XYZ comparison Where X: longitude,Y: latitude, Z: depth Compare the Z value with SEABEAM & SEABAT
1)Cruise Track Line • Blue line • (SeaBeam) • Ship speed 10.0knt • Red line • (SeaBat) • Ship speed 11.3knt
KR NT Bathymetric map
2)The data before editing Y : the number of pings X : the distance of the width
N + + ・・・ + = N 3)Average the data 50m 50m
50m 138.625E/138.675E/34.975N/35.012N 50m 4000m 4000m Choose SEABEAM & SEABAT data
Beam Footprint 1400m 50m
4)X-Y comparison Y R KR NT R = 25m Data 21930 X
Z comparison KRz Z NTz Δd= KRz - NTz Y X
NTz m (SEABAT) Depth comparison KRz m (SEABEAM)
Histogram COUNT Δd:Average=5.1m Δd (m)
Summary and future plans ・ SEABEAM & SEABAT bathymetric data were almost the same. But, the average depth of the SEABAT data was less than the SEABEAM data. ・ We need check the data from another area and a shallower and deeper area.
Almost the same map Thank you for your attention
Sound Velocity • Using SeaPatch tool
edit SVP After change the Sound Velocity
Histogram COUNT Δd:Average=-0.1m Δd (m)
A term • KR04-00(08/03/2004 - 16/03/2004) 11/03/2004 Ship speed 10.0knt Current 110.2°, 0.5knt Wind 217.1 °, 13.4m/s • NT04-00(23/01/2004 - 07/02/2004) 29/01 + 01/02/2004 Ship speed 11.3knt Current 260.1°, 2.0knt Wind 236.2 °, 0.3m/s
R/V KAIREI • Length105.2m • Wdth16.0m • Depth7.3m • Draft4.5m • Displacement 4,628ton
M/V NATSUSHIMA Length 67.4m Wdth13.0m Depth6.3m Draft3.6m Gross tonnage 1,739ton
VRU Morison sensor • KR…. • NT…OCTAN
Synthesis of cross fan-beam transmit fan-beam(①) receive fan-beam(②) cross fan-beam by synthesis effect(③) ② ① ③
Brock diagram - manga Motion Sensor Navigation Interface Recording Mapping transceiver Sound Velocity
raw edit Bathymetric map before and after edit
調査時期 • KR04-01(2004/01/07-2004/01/25) 18/01/2004 Ship speed 10.1knt Current 167°, 1.2knt • NT04-06(2004/06/17 - 2004/06/23) 17/06/2004 Ship speed 8.8knt Current 209°, 0.2knt
A process to verify an error誤差検証過程 1.Edit the data 2.Average the data 3.Grid Setting 4.XYZ Normal distribution
Between KR to NT Δd (m) XY Distance from KR to NT
Grid Setting Choosing grids setting from the manual: G = 100m G = D * F / b Where G : an average grid cell size D : the water depth F : the swath coverage factor b : the number of beams
KR NT Bathymetric map after edit
Estimation • Slope 0.954 • Average Δd 5.1m SEABEAM & SEABAT have a line correlation. Average depth is shallower SEABAT than SEABEAM. Δd is not varied. It’s like a pointed mountain.