Download
1 / 38
380 likes | 463 Views
An Optimal Control Model for Traffic Corridor Management. Ta-Yin Hu Tung-Yu Wu Department of Transportation and Communication Management Science, National Cheng Kung University, Taiwan, R.O.C. 2010.10.27. OUTLINE. Introduction Literature Review Methodology

E N D
An Optimal Control Model for Traffic Corridor Management Ta-Yin Hu Tung-Yu Wu Department of Transportation and Communication Management Science, National Cheng Kung University, Taiwan, R.O.C. 2010.10.27
OUTLINE • Introduction • Literature Review • Methodology • Research Framework • Model Formulation • Optimization Process • Numerical Experiments • A test network • A real city network • Concluding Comments 17th ITS WORLD CONGRESS
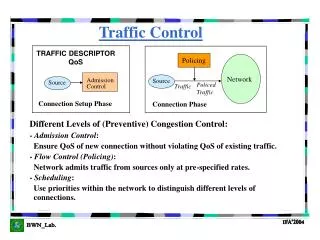
Introduction • Literature Review • Methodology • Numerical Experiment • Concluding Remarks 17th ITS WORLD CONGRESS
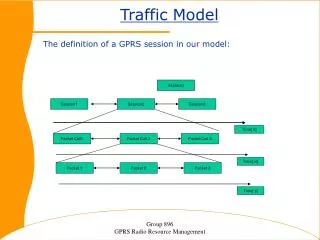
Background • Basically, a traffic corridor includes three major parts: • Mainline Freeway segments • On-ramps and off-ramps • One or more parallel surface streets 17th ITS WORLD CONGRESS
Motivation • Traffic jams occur in many traffic corridors because of increasing number of vehicles and insufficient traffic infrastructure. • Under ITS, the intelligent corridor management can utilize route guidance, ramp control and signal control, to improve the efficiency and enhance the service quality of corridors. 17th ITS WORLD CONGRESS
Papageorgiou (1995) developed a linear optimal control model to optimize the traffic corridor, and the model takes freeways, on-ramps and parallel arterial streets into consideration. • The concept of the model is based on the store-and-forward model (Gazis and Potts, 1963) • The advantage of the store-and-forward model is that a single performance index is used to evaluate the system. 17th ITS WORLD CONGRESS
Objectives • to develop a linear mathematical model for the ICM based on the store-and-forward model • to explicitly consider route guidance strategies • to optimize related decision variables 17th ITS WORLD CONGRESS
Introduction • Literature Review • Methodology • Numerical Experiment • Concluding Remarks 17th ITS WORLD CONGRESS
Moreno-Banos et al. (1993) proposed an integrated control strategy addressing both route guidance and ramp metering. • Diakaki et al. (1997) described a feedback approach with consideration of the overall network. • Mehta (2001) integrated DynaMIT with the Traffic Management Center and MITSIMLab especially toward Boston’s Central Artery Network. 17th ITS WORLD CONGRESS
Kotsialos et al. (2002) proposed a generic formulation for designing integrated traffic control strategies for traffic corridor. • Kotsialo and Papageorgiou (2004) provided an extensive review for the methods used for the design of freeway network control strategies. • Papamichail et al. (2008) presented a non-linear model-predictive hierarchical control approach for coordinated ramp metering of freeway networks. 17th ITS WORLD CONGRESS
Introduction • Literature Review • Methodology • Numerical Experiment • Concluding Remarks 17th ITS WORLD CONGRESS
Research Framework Collect the information, such as flow data Establish the mathematical model for the traffic corridor including urban streets, ramp, and freeway. Route Guidance Strategies Solved the Problem by CPLEX Results analysis for different traffic situations. 17th ITS WORLD CONGRESS
Model Formulation • Assumptions: 1. Discrete time interval, time-dependent problem 2. The operation of traffic corridor is under the same management level; therefore, data and information can be exchanged 3. For signalized intersection: • The cycle time is fixed. • Based on a fixed number of phases. • The total lost time of intersection is given. 17th ITS WORLD CONGRESS
Notations: • xij(k) is the queue length of movement from i to j at time interval k. • qi(k) is the inflow of section i at time interval k. • ui(k) is the outflow of section i at time interval k. • ri(k) is the metering rate of section i at time interval k. • τ is the time interval. • Objective Function: • Minimize the total queue length. • Min JD = τ × ΣΣ xij(k) 17th ITS WORLD CONGRESS
Mainstream of Freeway • Flow conservation qH2(k) = uH1(k) + uR1(k) qH3(k) = uH2(k) - qR2(k) • Queue length xHi(k+1) = xHi(k) + τ[qHi(k) - uHi(k)] xmax,Hi = βHi(ρmax,Hi – ρcr,Hi) 0 ≦ xHi(k) ≦ xmax,Hi qi(k):inflow ui(k):outflow qi(k):inflow ui(k):outflow xi(k):queue length βHi :length of section 17th ITS WORLD CONGRESS
On-ramp Control • ALINEA ri(k+1) = ri(k) + H[oi* - oout,i(k)] oout,i(k) = (βv+ βd) × ρcr,Hj(k) / 1000 ρcr,Hj(k) = qHj(k) / (βHj × nHj) • Outflow - on-ramp & off-ramp uRi(k) ≦ α × ri(k) uRj(k) ≦ usat,Rj • Queue length xRi(k+1) = xRi(k) + τ[qRi(k) - uRi(k)] 0 ≦ xRi(k) ≦ xmax,Ri qi(k):inflow ri(k):metering rate βHi :length of section βv :length of vehicle βd :length of detector ni:number of lanes ui(k):outflow ri(k):metering rate qi(k):inflow ui(k):outflow xi(k):queue length 17th ITS WORLD CONGRESS
Urban Streets • Cycle, Green time, Lost time Σ gγ,μ = c – Lγ • Exit flow of a section. sUi(k) = tij × qUi(k) • Queue length xUi(k+1) = xUi(k) + τ[(1-tij)qUi(k) + dUi(k) - uUi(k)] 0 ≦ xUi(k) ≦ xmax,Ui • Inflow & Outflow qUi(k) = Σ tUi,UjuUj(k) uUi(k) = Sui × gUi(k) / c c:cycle time g:green time L:lost time qi(k):inflow si(k):exit flow tij :exit rate qi(k):inflow ui(k):outflow xi(k):queue length di(k):demand qi(k):inflow ui(k):outflow tuiuj :turning rate S :saturation flow rate g:green time c:cycle time 17th ITS WORLD CONGRESS
route guidance : VMS 17th ITS WORLD CONGRESS
Optimization Process • Formulation Construction • Use CPLEX to optimize the problem
Introduction • Literature Review • Methodology • Numerical Experiments • Concluding Remarks 17th ITS WORLD CONGRESS
The Test Network • includes a mainstream of freeway, ramps,and urban networks 17th ITS WORLD CONGRESS
Experimental Design • Objectives: • To observe the system performance in terms of objective values • To observe the variation of decision variables, such as green time and ramp metering rates • Experimental factor • Demand levels: 11 17th ITS WORLD CONGRESS
The Virtual Network Experiment 17th ITS WORLD CONGRESS
Change of Objective Values • It is obvious that objective values increase with respect to the demand level.
Differences of objective values between consecutive iterations High Level under saturation Median Level low Level 17th ITS WORLD CONGRESS
Comparisons of Different demand level. • Low demand level (case 1) • Number of vehicles 2400 vehicles • Total delay : 218vehs-min • Average values 0.091min • Median demand level (case 5) • Number of vehicles 4320 vehicles • Total delay : 14290 vehs-min • Average values 3.308 min • High demand level (case 8) • Number of vehicles 5760 vehicles • Total delay : 29636 vehs-min • Average values 5.145 min 17th ITS WORLD CONGRESS
Low Level Median Level High Level 17th ITS WORLD CONGRESS
Results of Green Time Allocations low Level In low and median level, more green time is allocated for the E-W. Median Level High Level In high level, more green time is allocated for the S-N. 17th ITS WORLD CONGRESS
Results of Metering rates low Level Median Level High Level 17th ITS WORLD CONGRESS
A Real Network – Taoyuan Network No. 31 No. 4 Freeway No. 2 Freeway No. 1
Low medium high Vehicles accessing airport also cause traffic congestion The interchange is a critical point in the network
Introduction • Literature Review • Methodology • Numerical Experiment • Concluding Remarks 17th ITS WORLD CONGRESS
Concluding Comments • The optimal control model is developed based on the concept of the store-and-forward, thus a linear model could be formulated to solve the problem. • The total queue length increases with respect to demand levels. • As the traffic is getting congested, the ramp metering rate drops dramatically • For the VMS applications, acceptance percentages need to be determined in advance. 17th ITS WORLD CONGRESS
Future Developments • Evaluate the optimal strategies through simulation models • Relax the cycle time constraints in the formulation • More variables • More constraints • Difficult to solve for the signal optimization problems 17th ITS WORLD CONGRESS
Thank You for Your Attention. 17th ITS WORLD CONGRESS