Download
1 / 45
480 likes | 698 Views
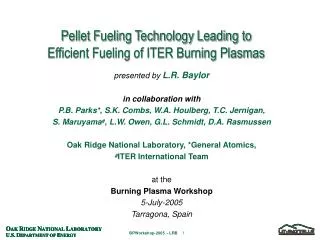
Pellet Fueling and ITPA Pellet Database Project. presented by L.R. Baylor in collaboration with S.K. Combs, T.C. Jernigan, A. Geraud (CEA), P. Lang (IPP), W. Houlberg, A. Polevoi (ITER), K. Kizu (JAERI), B. Kuteev (Ioffe PTI), P. Parks (GA), G. Schmidt (PPPL) Oak Ridge National Laboratory.

E N D
Pellet Fueling and ITPA Pellet Database Project presented byL.R. Baylor in collaboration with S.K. Combs, T.C. Jernigan, A. Geraud (CEA), P. Lang (IPP), W. Houlberg, A. Polevoi (ITER), K. Kizu (JAERI), B. Kuteev (Ioffe PTI), P. Parks (GA), G. Schmidt (PPPL) Oak Ridge National Laboratory ITPA
Overview • Historical overview of pellet fueling for magnetic fusion • Pellet plasma interactions • Ablation physics well understood • Mass deposition process still under research • New developments and application to experiments • HFS fueling • Pellet triggered H-mode transitions • ELM triggering • Modeling and ITPA Pellet Database • Summary
Why Pellet Fueling? • Fusion power is a strong function of density • Pf = nDnT<sv>WDT • Gas puffing has limited ability to achieve core fueling (this is especially true in ITER) • Ionization rates for H2-> H+ + H peak ~100eV, thus limiting the penetration of neutrals • Pellets can provide much deeper fueling • Strong fueling needed to reduce Zeff • Impurities reduce fuel ion density • nZ increases radiation losses • nZ affects tE
Historical Overview of Pellet Experiments • Improved Confinement • Extension to improved confinement at high density ce µ ne-1 (Alcator C, DIII, TFTR) • Density Limits Exceeded • Gas fueled density limits extended with pellet fueling • PEP-mode - triggering of internal transport barrier • Pellets trigger formation of ITB with central heating (JET, C-Mod, DIII-D, TFTR, JT-60) • Pellets enable tests of ITB theory
Improved Confinement • Early pellet experiments on ISX-B and later on Alcator C showed a definitive improvement in energy confinement with pellet fueled plasmas. (Greenwald, Phys. Rev. Lett. 53, (1984) 352.) • Reduced ITG mode turbulence due to peaked density profile proposed as improvement mechanism. • Similar scaling seen on DIII with multiple centrifuge pellet injection. (Sengoku, et al. IAEA 1984)
Density Limits • Experiments on many machines have shown that pellet fueled plasmas can greatly exceed the empirical Greenwald density limit. • This TFTR example reached more than 2x the Greenwald density. (Bell, M.G., Schmidt,G. L., et al, Nucl. Fusion 32 (1992) 1585)
PEP-Mode / Internal Transport Barriers • Central deposition from pellet fueling can lead to strongly peaked density profiles that produce internal transport barriers. • This JET example using the ORNL RPI (Schmidt, Baylor, Milora, et al.) showed good ICRH coupling to peaked density pellet fueled plasmas. (Bhatnagar, V.P., et al., PPCF 31 (1989) 2111.)
Tore Supra Studies of Long Pulse Pellet Fueling • Long pulse fueling with LHCD was shown to be possible with notching of the LH power. (Geraud, Foster, et al, EPS 1989). • IPADBASE - International Pellet Ablation DataBase (Baylor, Geraud, et al, NF 1997). • PEP-mode studies with ICRH
Pellet - Plasma Interactions • Pellet Ablation Physics - Models for ablation rate developed that successfully match experimental results • Mass Deposition - Simple models of “plasma blob” remaining on field lines are not adequate • Pellets Induced ELMs - edge localized modes are triggered in H-mode by the strong perturbation from pellets
Pellet Mass Deposition is Different from Ablation Process • Pellet ablation well understood with neutral gas shielding (NGS) models (Parks, Milora, Kuteev, Lengyel …) • Assumes pellet particles remain where ionized • Pellet Deposition describes where the pellet mass is distributed in the plasma. • Measured density profile before and after pellet ablation. • Data suggests it is vastly different from simple ablation model
1 0.8 0.6 Theroetical Penetration l/a 0.4 JET Tore Supra 0.2 DIII-D TFTR FTU 0 0 0.2 0.4 0.6 0.8 1.0 Measured Penetration l/a Pellet Penetration is Well Characterized, but Deposition Profile from LFS Injection is Anomalous IPADBASE 8 DIII-D t = 7.0 ms 92703 2.7 mm Vp = 906 m/s 6 Dne (1019 m-3) Measured 4 NGS Model 2 0 5 H-mode 4.8MW NBI 4 Ablation Emission (a.u.) 3 2 1 0 0.0 0.2 1.0 1.2 0.4 0.6 0.8 • Maximum Penetration depth agrees well with theory over a range of data from many devices. (Baylor, et al., Nucl. Fusion 37, 445 (1997) ) • Mass deposition implies fast radial transportduring the ablation process. • ASDEX Upgrade HFS injection experiment first to test this hypothesis.(Lang, et al., Phys. Rev. Lett. 79, 1478 (1997.))
First HFS Pellet Injection Results • Higher fueling efficiency observed with pellet injected from the inner wall. (Lang, et al, PRL 1997). • Since this time more detailed experiments have been performed to quantify the improved mass penetration observed.
Pellet Fueling Program on DIII-D • Modifications to injector(that was installed on JET 1987-91): • All three guns fire 1.8 or 2.7 mm pellets • Punch mechanisms to generate slower pellets ( < 300 m/s) • 2 independent guide tubes on inner wall (HFS) - midplane, 45° and vertical V+1 • Can be connected to any of the pellet guns or a gas valve • Curved guide tube limits speed to 250 m/s for intact pellets(Combs, SOFE Proceedings, 1999)
DIII-D Pellet Injection Locations - 2003 HFS guide tubes V+1,V+3 vertical guide tubes LFS guide tubes • Elevation view of pellet trajectory in the plasma • 3-D view showing curved guide tubes that the pellets traverse
10 DIII-D 99477 H-mode 7MW NBI Measured Dne Dt = 0.25 ms ne (1019 m-3) 5 Pellet Da HFS 45° vp = 153 m/s l = 17cm 0 0.8 0.0 0.2 0.4 0.6 1.0 1.2 DIII-D HFS 45° Pellet Injection Deposition Suggests Major Radius Drift of Ablatant 2.7 mm Pellet -HFS 45° NGS Model (x 0.4) r =0.8 r =0.4 • The deposition shows deeper fueling than predicted • Pellet Da emission agrees with ablation model (PELLET code) • A radial drift of 20 cm is inferred from the data - for comparison with detailed drift model (Parks, Phys Plasmas 2000)
2.7 mm Pellets -HFS 45°vsLFS 10 DIII-D 98796 - measured Dne HFS 45° vp = 118 m/s Dt = 5 ms LFS vp = 586 m/s Dt = 1 ms ne (1019 m-3) 5 Calculated Penetration 0 0.8 0.0 0.2 0.4 0.6 1.0 1.2 High Field Side (HFS 45°) Pellet Injection on DIII-D Yields Deeper Particle Deposition than LFS Injection Fueling Efficiency: HFS - 95% LFS - 55% • Net deposition is much deeperfor HFS pellet in spite of the lower velocity • Pellets injected into the same discharge and conditions (ELMing H-mode, 4.5 MW NBI, Te(0) = 3 keV)
Vertical HFS and Vertical LFS Pellet Injection are Consistent with an Outward Major Radius Drift of Pellet Mass 2.7mm Pellet - Vertical HFS vs LFS 1.0 V+3 LFS H-mode - 4.5 MW vp = 200 m/s V+1 HFS H-mode - 6.5 MW vp = 417 m/s ne (1020 m-3) 0.5 Radius of Vertical Port 0.0 0.8 0.0 0.2 0.4 0.6 1.0 1.2 • The net deposition profile measured by Thomson scattering 2-4 ms after pellet injection on DIII-D. V+1 HFS indicates drift toward magnetic axis while V+3 LFS suggests drift away from axis.
HFS Pellet Injection on DIII-D Yields Deeper Particle Deposition than Predicted by Ablation Model HFS LFS • HFS and Vertical injection show deeper than expected deposition of pellet mass from simple ablation model • LFS pellet maximum deposition depth agrees with simple model
HFS Comparison HFSmid Yields Deeper Deposition than HFS45 HFSmidvsHFS 45° 5 1.20 DIII-D 103688 1.00 4 HFSmid 153 m/s HFS45 223 m/s 0.80 3 Measured Penetration Depth l/a ne (1019 m-3) 0.60 2 0.40 HFSmid 1 0.20 HFS45 0.00 0 0.0 0.2 0.4 0.6 0.8 1.0 0.00 0.20 0.40 0.60 0.80 1.00 1.20 Calculated Penetration Depth l/a r • A direct comparison of same size 2.7mm pellets in the same shot shows showsslightly deeper fueling from HFSmid than from HFS45 trajectory. DIII-D database results also show this trend.
Application of High Field Side Injected Pellets • PEP-mode - overview and transport summary • PIH-mode - pellet induced H-mode overview • Pellets enable test of transition theory • Pellet induced ELMs - edge localized modes • HFS/LFS pellet comparison
10 2 20 DIII-D 99787 DIII-D 99787 8 PEP ITB Ip (MA) 1 10 6 PNBI (MW) ne (1019 m-3) 4 H-mode 0 0 2 6 non-PEP ITB PEP ITB 0 4 ne (1019 m-3) PEP 5 2 6 Ti (CER) Collapse non-PEP ITB (99788) 5 4 Te (TS) 0 Te, Ti (keV) 4 3 q(0) 8 q 6 3 2 4 qmin 2 1 q 2 0 0 0 0.4 0.2 0.8 0.6 1.0 1.0 1.1 1.2 0.7 0.8 0.9 0.5 0.6 r Time (s) HFS Pellets During Current Rise Lead to Internal Transport Barrier - PEP mode • HFS 2.7mm pellets injected during current rise produce highly peaked density profiles that develop PEPITB with Ti»Te • PEP survives transition to H-mode and can persist for > 1s • Core collapse occurs as qmin reaches 3/2 • Steepest ne, Te, Ti gradients occur inside rqmin
HFS Pellets have induced H-mode Transitions 8 HFS Pellet 6 ne (1019 m-3) L-mode Target 4.8MW NBI Upper Single Null 4 2 Upper Divertor ELMs D(a.u.) 1 0 8 r = 0.1 4 ne (1019 m-3) r = 0.9 0 3.7 3.8 3.5 3.6 3.9 Time (s) • HFS pellet induces H-mode transition that is maintained • H-mode power threshold reduced by 2.4MW (up to 33%) using pellet injection (P. Gohil APS1999, submitted to PRL)
HFS Pellets produce different ELM characteristics than LFS pellets. DIII-D 99474H-mode9.5 MW 9 8 LFS 760 m/s ne (1019 m-3) HFS 45 169 m/s 7 6 Lower Divertor (PHD04) ELM 1.0 ELM 25 ms duration 4 ms duration Da (a.u.) 0 1.69 1.83 1.85 1.82 1.84 1.70 1.71 1.81 1.72 1.80 1.73 1.74 Time(s) Time(s) • HFS pellet induced ELMs are small like background ELMs • LFS pellets induce large ELMs much longer lasting than background ELMs. ExB drift loss of particles may be responsible. • P´ modification at edge may be different for HFS and LFS pellets (J.R. Ferron, APS1999)
Pellet Fueling Efficiency for LFS Pellets Scales with Increased Penetration Depth 1.0 0.8 h 0.6 Fueling Efficiency 0.4 AUG L-mode AUG H-mode 0.2 DIII-D H-mode Tore Supra L-mode Gas 0.0 1.0 1.2 0.0 0.2 0.4 0.6 0.8 l Penetration Depth /a • ASDEX-U and Tore Supra fueling efficiency data yield similar results to the DIII-D LFS pellet data. Only DIII-D H-mode (ELMing and ELMfree) data is shown here.Data is from IPADBASE (Nucl. Fusion, 37 (1997) 445.)
Pellet Fueling Efficiency in DIII-D ELMing H-mode Shows Improvement with Penetration Depth 1.0 0.8 0.6 Fueling Efficiency 0.4 Hmode LFS Hmode V+1 0.2 Hmode HFS Gas 0.0 0.0 0.2 0.4 0.6 0.8 Axis Edge Penetration (m) • Fueling Efficiency in DIII-D ELMing H-mode plasmas is higher with deeper penetration, but a clear difference with injection location is apparent. Gas fueling efficiency from IW and GASA are significantly lower than the pellet fueling efficiency.
Fueling Source Profile Comparison Gas and Pellets in ELMing H-mode 1000 HFS Pellet LFS Pellet V+1 Pellet Recycle 100 Gas D+ 1019 cm-3 s-1 10 1 0.0 0.2 0.4 0.6 0.8 1.0 r • The gas and divertor recycling fueling rates profiles are much more edge localized than the net pellet fueling rates. The pellet rates are from experimental pellet deposition (Baylor, et al., Phys. Plasmas 7 (2000) 878 ) from a single 2.7-mm pellets extrapolated to 3 Hz operation. The pellet fueling depth is considerable deeper as expected.
JET – HFS/LFS Comparison Shows Improved Fueling with HFS Pellet Injection • JET has installed guide tubes for HFS and Vertical injection with a centrifuge injector. Pellet speeds of ~150-300 m/s are realizable (Watson, et al, SOFE 1999). • Results from HFS presented at EPS 2000 (Jones, EPS 2000) and Vertical will be EPS 2003 (Geraud, Garzotti, Lang EPS 2003). • HFS Trajectory is not optimal as pellet trajectory only reaches r = 0.7.
3-O 3-I Pellet 2.5-U Pellet Pellet Pellet Injection from Different Locations on LHD – Initial Results Show Marginal Difference 3-Outside 3-Inside 2.5-Upper • Initial pellet experiments on LHD from different injection locations indicate marginal difference in the deposition profile (Sakamoto et al., to be published).
Modeling and ITPA Database • Physics Models - Models for mass redistribution based on ExB polarization drift and high beta drift have been developed. • ITPA Pellet Database – Extension of IPADBASE to include injection location effects and mass redistribution. • Database Design - Utilize tools from other ITPA databases for ease of access to data by modelers.
Theoretical Model for Pellet Radial Drift • Polarization of the ablatant occurs from B and curvature drift in the non-uniform tokamak field: • The resulting E yields an ExB drift in the major radius direction ExB Polarization Drift Model of Pellet Mass Deposition(Rozhansky, Parks) B Pellet Ablatant (Cloud) - • The velocity of ablatant cs(2L/R)0.5.For DIII-D this is 2 km/s, i.e. faster than the pellet(deKloe, Mueller, Phys.Rev.Lett. (1999)) • R stronger at higher plasma • Detailed model by Parks, P.B. (Phys. Plasmas 1968, (2000).) E LFS HFS - + + ExB R B µ 1/R
Radial Displacement Model for Drift of Pellet Mass • The problem entails coupling the equation of motion for the drift velocity and radial penetration distance with the 1-D time dependent parallel expansion model. The non-dimensional drift equation becomes: where u is the radial velocity, x is theradial position,g is a dimensionless acceleration parameter and I is the dimensionless cloud inertia. • The non-dimensional acceleration is a function of the pressure difference : where x is the normalized Lagrangian distance (z/Lc) from the midplane of the cloudlet.
Radial Displacement Model for Drift of Pellet Mass – Additional Effects to Consider • The model does not include any dissipative effects such as diffusion of the cloud radially as it expands along the field lines. The cloud diameter is assumed constant as it moves. • Because of the lack of a dissipative effect, the model would predict that pellets injected from the LFS are completely expelled from the plasma. We know this is not the case as shown in slides above, where up to 50% of the pellet mass from LFS pellets is retained in the plasma. A shedding of the pellet cloud is included as the field line twists. As the cloud moves from 0.3-1 times is diameter it is shed. • The model assumes that the plasma is unperturbed in front of the pellet – thus it does not include the possibility that the cloudlet moves in front of the pellet to pre-cool the plasma. This effect would enhance the pellet penetration but then reduce the radial drift drive mechanism.
1-D Lagrangian Code – Pellet Relaxation Lagrangian (PRL) • The parallel temporal expansion dynamics for a discrete cloudlet is described by a 1-D Lagrangian fluid model. • Lagrangian coordinates do not determine a given point in space, but a given fluid mass [Zel’dovich]. The Eulerian coordinate x does not enter the equations explicitly. • The gas dynamic flow variables are expressed in terms of Lagrangian coordinates that express the changes in density, pressure, and velocity of each fluid element with time. Pellet + Cloud Cloudlet Q Lagrangian cells of constant mass Heat flux
Modeling with Pellet Relaxation Lagrangian (PRL) • The pellet ablation is modeled with the PELLET code to get the particle source rate from the pellet. • The PRL code uses the pellet size at each point along the ablation track to calculate the penetration of a cloudlet originating at that point. • The experimental plasma profiles are fed into PRL to calculate the cloudlet relaxation. • The ablation deposition is then shifted for each cloudlet to give a resulting plasma density profile, which can be compared with experiment. Cloudlets Resulting Deposition PELLET Deposition ne PRL drift
PRL Code Coupled with Ablation Model Predicts Reasonable Deposition Profile 30 DIII-D 98796 25 PELLET 20 Dne (1019 m-3) 15 Measured 10 5 PRL 0 r 0 0.2 0.4 0.6 0.8 1 • Comparison of the resulting mass deposition from a 2.7mm pellet from the experimental density profile change (measurement), pellet ablation code (PELLET), and ExB drift model (PRL code) coupled with the ablation code output.
PRL Code Coupled with Ablation Model Predicts Deep Penetration for ITER 3.0E+20 2.5E+20 2.0E+20 Dne (1019 m-3) PELLET NGS 1.5E+20 1.0E+20 PRL 5.0E+19 0.0E+00 0 0.2 0.4 0.6 0.8 1 1.2 r • Plot of the resulting mass deposition from a 10 mm pellet in ITER for a 300 m/s inner wall injection. Assumed pedestal Te was 3.5 keV and central Te was 30 keV. The shedding parameter was 0.33 (the same as DIII-D simulations).
1.2 ITER 10mm 300m/s 1.0 0.8 0.6 0.4 0.2 0.0 0.0 1.0E-04 2.0E-04 3.0E-04 4.0E-04 PRL Code Time Scale of ExB Drift r Time (s) • The position of the pellet cloudlet that starts at r = 0.96 is plotted as a function of time. The time scale for the cloudlet to reach its final position is on the order of 100 msec. This is consistent with experimental observations that the drift occurs in less than 250 msec. • The cloudlet speed reaches 104 m/s, much faser than the pellet, thus pre-cooling the plasma in front of the pellet.
ITER Fueling Source Profile Comparison Gas and Pellets in H-mode 1000 100 10 B2-Eirene slab calculation (L.Owen & A. Kukushkin) D+ 1019 cm-3 s-1 1 0.1 HFS Pellet 0.01 Gas Fueling Efficiency < 1% LFS Pellet Gas 0.001 0.0 0.2 0.4 0.6 0.8 1.0 r • The gas fueling rate profile is much more edge localized than the net pellet fueling rates. The pellet rates are from PRL calculations using a 10-mm pellet extrapolated to 1 Hz operation. A gas fueling rate of ~1000 Torr-l/s is used.
DIII-D Comparison with Strauss MHD Scaling • A database of inner wall launched pellets has been formed to look at the scaling of the Strauss MHD simulation (Strauss, Phys. Plasmas, 1998). r r - vs calculated density perturbation Parameters at Calculated Penetration 0.90 0.80 Inside Midplane Inside Upper (45º) 0.70 0.60 Dr 0.50 0.40 0.30 0.20 0.10 0.00 0.00 0.10 0.20 0.30 0.40 0.50 0.60 (bq2/N) *1022 • Initial results do not suggest good agreement with this scaling. More data is needed with stronger variations in q in order to better examine this model.
ITER Pellet Redistribution Calculation with MHD Displacement Model • SMART calculations (Polevoi & Shimada, PPFC 2001) predict fairly deep fueling in ITER from shallow penetrating pellets. The same plasma parameters are used as in the PRL model results.
ITPA Pellet Database • ITPA Pellet Database – Extension of IPADBASE to include injection location effects and mass redistribution. • Pre-pellet plasma parameters and geometry: Ip, Bt, Rm, a, etc. • Pellet parameters and trajectory: vp, rpel, lpel(r) • Pre and post pellet plasma profiles: Te(r), ne(r), q(r), etc. • Pellet ablation data: Halpha(t), Tcloud(t), ncloud(t)
ITPA Pellet Database • Database Design - Utilize tools from other ITPA databases for ease of access to data by modelers. • Utilize MDSplus – Make use of profile database structure and search tools. • Data Submission – Parameters in Excel spreadsheet with profiles in UFILE format. • Data output – Utilize IDL procedures to extract database data for specific modeling codes.
Summary • Pellet experiments in the past 20+ years have resulted in better concepts for reactor fueling. • Strong coupling to technology developments has resulted in many experiments with important plasma physics results. • HFS pellet injection is very promising for deep fueling of ITER plasmas: • Modeling efforts underway to quantify pellet mass drift Uncertainty in extrapolation to ITER is very large • High fueling efficiency for reduced tritium retention • HFS pellets for ELM mitigation • ITPA Pellet Database will enable modelers to have access to experimental data to better qualify models. (Suggestions for implementation details are welcome)
NGS Pellet Ablation Java Code Available on Web at: http://www.ornl.gov/fed/pellet/NGSpellet.html
What Happens when a Pellet is Injected into an H-mode Plasma? DIII-D 90674 BT= 2.1T ELMing DIII-D 90612 BT= 1.5T ELM-free 3.5 4.5 L L neL neL Pellet Pellet 2.5 3.5 2.5 1.5 5.0 8.0 Divertor H(a.u.) Divertor H(a.u.) ELM 2.5 4.0 0.0 0.0 dB/dt (a.u.) dB/dt (a.u.) 1.68 1.70 1.72 1.74 1.76 1.68 1.70 1.72 1.74 1.76 Time(s) Time(s) • The pellet (2.7mm) triggers an ELM and L-mode transition that varies in duration with BT. The transition back to H-mode scales like the H-mode threshold: Pthres ~ 0.3 neL BT R2.5(Ryter, et al. Nucl. Fusion 36 (1996) 1267. )