1 / 1

usoa
Download Presentation

An Image/Link below is provided (as is) to download presentation Download Policy: Content on the Website is provided to you AS IS for your information and personal use and may not be sold / licensed / shared on other websites without getting consent from its author. Content is provided to you AS IS for your information and personal use only. Download presentation by click this link. While downloading, if for some reason you are not able to download a presentation, the publisher may have deleted the file from their server. During download, if you can't get a presentation, the file might be deleted by the publisher.

E N D

Presentation Transcript


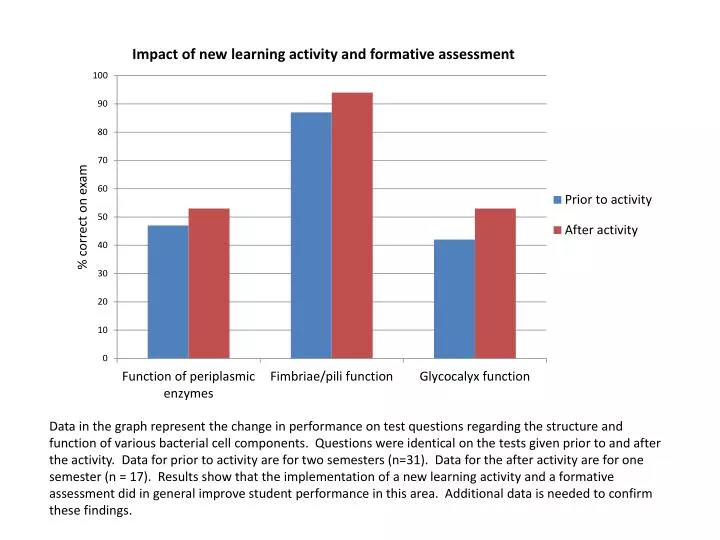
  1. Data in the graph represent the change in performance on test questions regarding the structure and function of various bacterial cell components. Questions were identical on the tests given prior to and after the activity. Data for prior to activity are for two semesters (n=31). Data for the after activity are for one semester (n = 17). Results show that the implementation of a new learning activity and a formative assessment did in general improve student performance in this area. Additional data is needed to confirm these findings.

More Related