Download
1 / 91
920 likes | 1.2k Views
Drosophila Population Genetics Brian Charlesworth Institute of Evolutionary Biology School of Biological Sciences University of Edinburgh. Why is intra-specific variability interesting?.

E N D
Drosophila Population Genetics Brian Charlesworth Institute of Evolutionary Biology School of Biological Sciences University of Edinburgh
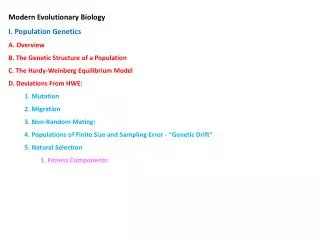
Why is intra-specific variability interesting? A high degree of variability is obviously favourable, as freely giving the materials for selection to work on… Charles Darwin, The Origin of Species, Chap. 1. Darwin was the first person to recognize clearly that evolutionary change over time is the result of processes acting on genetically controlled variability among individuals within a population, which eventually cause differences between ancestral and descendant populations. Knowledge of the nature and causes of this variability is crucial for an understanding of the mechanisms of evolution, animal and plant breeding, and human genetic diseases.
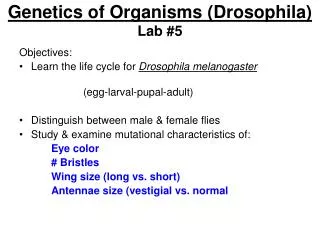
Classical and quantitative genetic studies of variation Classical genetics reveals the existence of discrete polymorphisms in natural populations, but is necessarily limited either to chromosomal rearrangements such as inversions that can be detected cytologically, or to conspicuous phenotypes such as eye colour or body colour (flies carrying certain eye-colour mutations such as cardinal can be found in natural populations). Within a given species, only a handful of such polymorphisms can easily be detected. Relatively few cases of discrete polymorphisms affecting morphological traits are known.
The classic polymorphism of Drosophila pseudoobscura A human inversion polymorphism
Quantitative genetics reveals the existence of ubiquitous genetic variation in metrical and meristic traits. Most metric traits have a coefficient of variation (the ratio of the standard deviation to the mean) of 5-10%. Measurements of the resemblances between relatives show that 20%-80% of the variance in such traits is typically due to genetic factors. This type of variation is of great evolutionary, medical and economic significance, but measuring it does not tell us anything about the details of its genetic control (numbers of loci involved, frequencies of variant alleles, etc.).
Studies of concealed variability (revealed by inbreeding) indicates the existence of low frequency recessive alleles usually with deleterious effects, that are not normally detectable in a large random-mating population. The results of close inbreeding (e.g. by brother-sister matings) are: 1. Reduced mean performance of a set of inbred lines, with respect to traits like survival, fertility and growth rate. 2. Increased variability among lines, sometimes involving abnormalities caused by single gene mutations.
While amply validating Darwin’s view that there is plenty of variation available for evolution to utilize, this evidence leaves two important questions unanswered: • How much variation within a natural population is there at an average locus? Classical genetics provides no means of sampling loci at random from the genome, without respect to their functional importance or level of natural variability. • To what extent does natural selection as opposed to mutation and/or genetic drift control the frequencies of allelic variants within populations? The classical genetics bias towards genes with conspicuous phenotypic effects means that strong selective forces are likely to be operating. Such genes might well be unrepresentative of the global picture.
Molecular genetics to the rescue The solution to question (a) is to use the fact that genes correspond to stretches of DNA that code for proteins. If either the protein sequence corresponding to a gene, or its DNA sequence, can be studied directly, then we can look at variation within the population without having to follow visible mutations, i.e. there is no need for prior knowledge of the existence of variation. We can also look at variation in non-coding sequences.
Electrophoretic variation The first steps were taken in the mid-1960s by Lewontin and Hubby, working in Chicago on the fruitfly Drosophila pseudoobscura, and by Harris in London, working on humans. They used the technique ofgel electrophoresis of proteins to screen populations for variants in a large number of soluble proteins controlled by independent loci, mostly enzymes with well-established metabolic roles. The proteins were chosen purely because they could be studied easily.
The results of the early electrophoretic surveys were startling: a large fraction (as high as 40%) of loci were found to be polymorphic (i.e. they exhibited one or more minority alleles with frequencies greater than 1%). An average D. pseudoobscura individual was estimated to be heterozygous at 13% of the 24 protein loci that had been studied by 1974 i.e. a random individual sampled from the population would be expected to have distinct maternal and paternal alleles at 13% of its protein-coding loci. Much lower levels of heterozygosity (or gene diversity: the chance that two randomly chosen copies of a gene are different) were found in mammals, and much higher levels in bacteria.
This work conclusively refuted the view that loci are only rarely polymorphic. However, it raised more questions than it answered. In particular, there were several biases in the data. Only soluble proteins could easily be studied, and amino-acid changes that do not affect the mobility of proteins on gels are not detected by electrophoresis. Similarly, any changes in the DNA that do not affect the protein sequence go undetected.
DNA sequence variation The advent in the late 1970s of methods for cloning and sequencing of DNA meant that studies of natural variation could be carried out at the DNA level. This eliminates virtually all the possible biases in quantifying variability. With the advent of PCR amplification for isolated specific regions of the DNA, and with relatively cheap automated sequencing, this is now the method most commonly used in surveys of variation. Efforts are currently under way in D. melanogaster to scale this “resequencing” up to the whole genome level.
The pioneering work on directly comparing homologous DNA sequences sampled within a species was carried out by Martin Kreitman in Lewontin’s lab at Harvard in the early 1980s. Kreitman sequenced 11 independent copies (alleles) of the Adh (alcohol dehydrogenase) gene of D. melanogaster, isolated from collections made around the world. He sequenced 2379 bases from each of these alleles, an heroic effort in those days.
His work succeeded in: • Demonstrating a high level of variability at the level of individual nucleotide sites, a factor of ten or so higher than would have been expected from the typical level of heterozygosity for protein polymorphisms • Showing that nearly all of this variability involved silent changes that did not affect protein sequences, i.e. the changes were either in regions that did not code for amino-acids or involved synonymous changes in codons. • The only amino-acid polymorphism detected was that already known to cause the difference between the fast (F) and slow (S) electrophoretic alleles of Adh.
Kreitman’s Adh Results Intron 1 Coding Region 3' Non-Transcr. % Silent Sites Segregating 1.7 6.7 0.6 No. Sites 654 765 767 No non-silent substitutions found (other than F/S): 39 are expected if variability were same as for silent sites.
These results demonstrate that the protein sequence is highly constrained by selection, i.e. most mutations affecting the amino-acid sequence of a protein cause selectively disadvantageous changes to its functioning, and are eliminated rapidly from the population. Most variation that is detected in coding sequences (typically over 85% in Drosophila) thus involves synonymous variants. Non-coding region variation shows a similar level to synonymous variation. These results suggest that most variation and evolution at the DNA level may be due to neutral or nearly neutral mutations, whose fate is controlled by genetic driftrather than selection, especially as much of the genome is non-coding, even in Drosophila.
How to measure DNA sequence variation Allele 1 ATGCTTAGCGTTGGCATCCTAGCGATCGAG Allele 2 ATGCTTGGCGTTGGCATCCTAGCGATCGG Allele 3 ATACTTAGCGTTGGCATCCTCGCGATTGAG
The nucleotide site diversity () for a given set of alleles sampled from a population is the frequency with which a randomly chosen pair of alleles differ at a given site. It can be calculated from data on a sample of homologous DNA sequences, by determining the sum of the numbers of differences between all possible pairs of sequences. The result is divided by the product of the number of sequences that were compared (this equals n(n-1)/2, if there are n independent alleles), and the number of bases studied.
In the example, n= 3, so n(n-1)/2 = 3. The total number of pairwise differences between all 3 combinations of sequences is 1 + 3 + 4 = 8. To get the pairwise diversity per site, we divide this by 3 times the number of sites, so that • = 8/(3 x 30) = 0.089
An alternative method of measuring variation is simply by counting the number of sites that are segregating in the sample, S. By dividing S by the product of the number of bases in the sequence and the sum a = 1 + 1/2 + 1/3 + ... + 1/(n -1) we obtain a statistic called Watterson’sw.
If the population is at equilibrium and there is no selection, w is expected to be similar in value to . In the example, we have S = 4, and a Hence: w= 4/(30 x 1.5) = 0.089
Under the neutral theory of evolution, variability in DNA sequences reflects the balance between the input of new variants by mutation and their loss by random fluctuations in frequencies caused by finite population size (genetic drift).
Under this model, variant frequencies at a locus are always shifting around, but a statistical equilibrium will eventually be reached if population size stays constant. The expected value of the pairwise diversity in the population is then given by: q = 4Nem where m is the neutral mutation rate per site, and Ne is the effective population size, which controls the rate of genetic drift. The expected values of both p and ware equal to .
Estimates of have now been obtained from many different kinds of organisms, by sampling sets of homologous genes from natural populations and sequencing them. Rough average values over many genes for silent nucleotide are as follows: • Escherichia coli (bacterium): 0.05 • Drosophila melanogaster 0.02 (African) • Homo sapiens 0.001
Knowledge of m enables us to estimate Nefrom q. For example, with m = 4 x 10⁻⁹, and q = 0.02, we obtain Ne = 1.25 x 10⁶. Drosophila effective population sizes are therefore very large.
Detecting Selection One of the major goals of evolutionary genetics is to understand to what extent selection, as opposed to neutral forces of mutation and genetic drift, controls variation and evolution in DNA and protein sequences. The methods for doing this often involves combining data on sequence divergence between species with data on polymorphism within species.
Forms of selection • Purifying selection, whichacts to prevent the spread of deleterious mutations, e.g. those affecting the amino-acid sequences of proteins. • Positive directional selection, which causes an adaptive mutation to spread through a species • Balancing selection, which maintains alternative variants in the population Directional and balancing selection are often collectively referred to as positive selection.
Use of sequence divergence data The simplest situation is when we have two homologous (aligned) DNA sequences from a pair of related species. For the purpose of discussion, assume that all evolutionary change occurs by nucleotide substitutions, i.e. the sequence differences are caused entirely by one nucleotide base changing into another by mutation. This is usually the case for coding sequences, since insertions or deletions cause disruption of functionality.
Species 1 Species 2 T T The total time separating a pair of sequences from the two species is 2T
Neutral sequence evolution Under neutral evolution, K is expected to be equal to the mutation rate (m) times the divergence time between the two species, i.e. K = 2 m T The simplest way to understand this is to note that, under neutral evolution, the expected number of mutations that distinguish a pair of sequences is equal to the time separating them (2T) times the rate of mutation per unit time (m).
We compare K values for nucleotide sites where mutations can reasonably be assumed to be neutral or nearly neutral with K for sites where we wish to test for selection; larger than neutralK values indicate directional selection, and smaller than neutralK values indicate purifying selection. Nonsynonymous sites are usually used as the candidates for selection, but there is increasing use of defined types of non-coding sequences.
Evidence for pervasive purifying selection This comes from the fact that both K and q for nonsynonymous variants are nearly always much smaller than for synonymous and noncoding sites.
Statistics on diversity and divergence in D. miranda (species 1: 18 loci) and D. pseudoobscura (species 2: 14 loci) All values are percentages Divergence (K) is measured between D. miranda and D. affinis. (KSbetween mirpseudo is 3.5%) L. Loewe et al. 2006 Genetics 172: 1079-1092.
Divergence of mel-sim introns P. Haddrillet al. 2005 Genome Biol. 6: R67. 1-8.
Effects of deleterious mutations on fitness • There are clearly a lot of deleterious mutations entering the population each generation, most of which will eventually be eliminated by selection • While the mean level of variability is much lower for nonsynonymous than synonymous mutations, this could simply mean that all the deleterious ones are rapidly removed by selection, so that the amino-acid variants that we see segregating are in fact selectively neutral.
It is a topic of current research to try and estimate the distribution of selection coefficients on deleterious amino-acid and silent variants in natural populations • Estimate for amino-acid variants indicate a wide distribution, such that the mean selection coefficient against a heterozygous non-synonymous variant is of the order of 10-5 • Values for synonymous or silent variants are much smaller, of the order of 10-6.
Positive directional selection Faster divergence in coding than non-coding sequences suggests positive selection • In the OdsH gene of three Drosophila species, divergence in the homeodomain is highly significantly accelerated • This directly suggests selection C. Ting et al. 1998 Science 282:1501-1504
The McDonald-Kreitman test • Compares non-synonymous and synonymous site divergence between species, and non-synonymous and synonymous site diversity within species, in the same gene • If variants at both kinds of sites were neutral, the numbers of substitutions at the two kinds of sites between two species should be in the same ratio as the polymorphism within either species, assuming equilibrium between drift and mutation: Neutral divergence = 2Tm Neutral diversity = 4Nem
If the ratio of non-synonymous variants to synonymous variants for differences between species is greater than the ratio for within-species variation, this suggests positive directional selection • If the opposite is the case, either purifying selection or balancing selection is acting
Centromeric histone protein evolution • Alignment of the Cid proteins of five melanogaster subgroup species with histone H3 proteins from D. melanogaster (2.3 million years divergence )with E. histolytica (> 1 billion years divergence) • The most divergent histone H3 sequences have >75% identity to each other, whereas centromeric H3-like proteins are much more diverged (35–50% identical to histone H3).
Sliding window analysis of Cid 50-nucleotide (nt) window, in steps of 10 nt, using all sites N-terminal tail region (mostly non-synonymous) p or K C-terminal core (mostly synonymous substitutions) intraspecific polymorphism within D. simulans (p) interspecific divergence (K)
Evidence for adaptive evolution in D. melanogaster & simulans Cid • Polymorphism was studied in D. melanogaster (15 strains) and D. simulans (8 strains), and divergence between them • Non-synonymous: synonymous (N:S) ratios differ significantly (P < 0.0025) • For divergence between the species = 18:10 • For pooled polymorphic sites within the two species = 9:28 • McDonald-Kreitman test for the D. melanogaster lineage (box): P < 0.006 H. Malik & S. Henikoff 2001 Genetics 157: 1293-1298
Using data on many different genes, methods have been developed to use the McDonald-Kreitman approach to estimate what fraction of amino-acid differences between D. melanogaster and D. simulans are caused by directional selection. This fraction is of the order of 25%, a surprisingly high value. N. Bierne & A. Eyre-Walker 2004 Mol. Biol. Evol. 21: 1350-1360.
Indirect evidence for selection: selective sweeps • After an advantageous mutation has spread through a population, the level of polymorphism will be reduced across the region (i.e. at closely linked neutral sites) • This is because a unique selectively favourable mutation may arise at a site in a DNA sequence that is completely linked to a polymorphic variant segregating in a population J. Maynard Smith & J. Haigh 1974 Genet. Res. 12: 12-35.
A selective sweep fixes variants linked to the selected siteIt is a form of hitch-hiking: • as the black (advantageous) variant increases in frequency in a population, it causes low diversity at closely linked sites in a sequence (white circles)
A recent selective sweep is detectable if the time since selective substitution is sufficiently small (around 0.25Ne generations), but there is a lot of noise
Indirect evidence for selection: statistics of variant frequency distributions • It is also possible to work out the frequencies at which variants are expected to be found in equilibrium populations, under both neutrality and selection • Under neutrality, most variants are expected to be quite rare • If selection is operating on the sequence, it will affect the frequencies of variants in the sample • This forms the basis for some tests for selection, and methods for estimating the intensity of selection.
Assuming neutrality and equilibrium, the expected value of both and w= 4Nem • If ≠ w, it suggests the possibility of selection • If there are excess rare variants, compared with what is expected under neutrality, this suggests purifying selection • Excess high frequency variants might suggest balancing selection or the presence of advantageous mutations spreading in the population • BUT there are two problems • We have to test whether the difference could be produced by chance • The population may not have been constant in size, as assumed in the model, and so its demographic history may cause ≠ w
Statistical tests must be used! • Things we estimate from a sample may look very different from the average that is expected • Statistical tests are necessary to decide whether a sample could not have arisen by a process of neutral mutation and drift. Only if we can say this, can we conclude that something such as selection has affected the sequences. • Neutrality is used as a null hypothesis
The spread of an advantageous mutation affects diversity very much like a bottleneck, but only on the region around the gene Extreme bottleneck One haplotype present, then new neutral variants occur < w , negative Tajima’s D Fixed advantageous mutation One haplotype selected, then new neutral variants occur < w , Tajima’s D < 0