Download
1 / 14
140 likes | 224 Views
Constant Velocity. Suzanne Louks. Project. This project came about from a curriculum/test analysis workshop where we looked at the Algebra practice test scores and decided where we needed improvement.

E N D
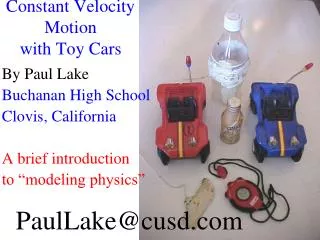
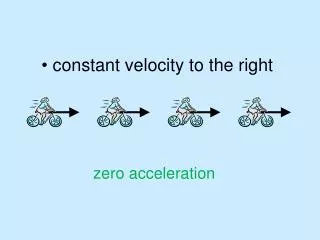
Constant Velocity Suzanne Louks
Project • This project came about from a curriculum/test analysis workshop where we looked at the Algebra practice test scores and decided where we needed improvement. • The intent was to incorporate as many of the Algebra frameworks into my curriculum as possible and improve on my kinematics lessons.
Focal Points • Graphing motion using both the Algebra and Physical Science frameworks.
Teachers Notes: Skills covered include: determining constant motion from a graph, creating a graphing, Creating a slope-intercept equation from graph or given information, independent and dependent variables Comparison of speed vs. velocity Understanding slope and y-intercept
Algebra Frameworks covered • LF.3.AI.4 - Identify independent variables and dependent variables in various representational modes: words, symbols, and/or graphs • LF.3.AI.5 - Interpret the rate of change/slope and intercepts within the context of everyday life (Ex. telephone charges based on base rate (y-intercept) plus rate per minute (slope)) • LF.3.AI.6 - Calculate the slope given • two points • the graph of a line • the equation of a line • LF.3.AI.7 - Determine by using slope whether a pair of lines are parallel, perpendicular, or neither • LF.3.AI.8 - *Write an equation in slope-intercept, point-slope, and standard forms given • • two points • a point and y-intercept • y-intercept and x-intercept • a point and slope • a table of data • The graph of a line • LF.3.Al.9 - Describe the effects of parameter changes, slope and /or y-intercept, on graphs of linear functions and vice versa. • NLF.4.AI.5 - Communicate real world problems graphically, algebraically, numerically and verbally
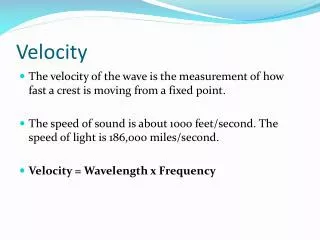
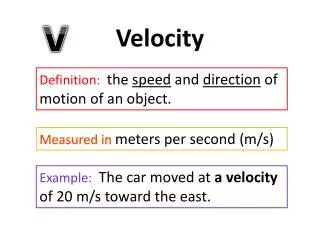
Physical Science Frameworks: P.6.PS.2- Explain how motion is relative to a reference point • P.6.PS.3 - Compare and contrast among speed, velocity and acceleration • P.6.PS.4 - Solve problems using the formulas for speed and acceleration: • P.6.PS.5 - Interpret graphs related to motion: distance versus time (d-t)
Time Frame I did this activity on the second day of covering motion. Background required – The students need to have covered one dimensional motion and graphing. They need to cover slopes and slope-intercept.
Teacher notes: • The teacher needs to make sure the students have the background to be successful. • The teacher will make sure all appropriate supplies are available. • Constant motion vehicle • Meter sticks • Timers The Teacher should divide the class into groups and assign jobs or have students choose jobs. timer measurer Marker recorder The Teacher should go over the lab with the class before performing it making sure students understand what is expected of them and answer any questions they may have.
Teacher Notes continued • The students are expected to have finished the pre – lab as homework. • They should ask any questions they have after the teacher describes the lab. • The students are expected to perform the lab as expeditiously as possible. • The students outcomes should include an increased understanding of graphing and slopes.
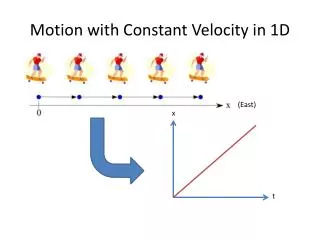
Activity • The students will measure the distance a constant velocity car goes in given intervals for a total of 30 seconds. • One student will call time • One student will mark cars position at time intervals • One student will measure distance between marks • One student will record the data
Activity continued • Students will then return to their groups and graph the data, analyze the data(determine speed from the slope) and draw their conclusions. • They will then answer the post lab questions. • The next day the class will review the lab, lab questions, and Homework.
Summary • The student really enjoyed the lab. We went outside under the pavilion. • You have to watch the boys because they want to get a little rough with the cars. • When they graphed the information and determined the speed of the vehicle it helped them understand the meaning of the slope. • The Algebra teacher told me a couple of weeks later that her kids told her about our experiment and that they understood the slope.
Reflection • This lab worked out really well. • I added the pre-lab after we did the lab to help ensure students have some background knowledge. • Their understanding of slope and graphing were increased according to their Algebra teacher.