Download
1 / 15
150 likes | 271 Views
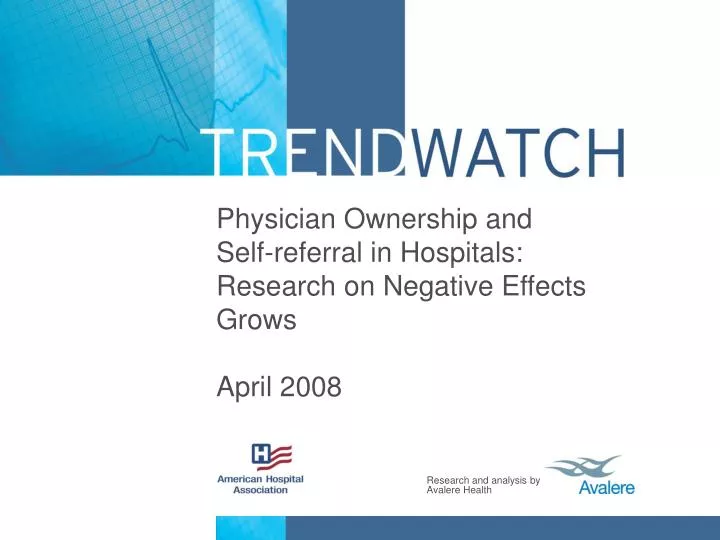
Physician Ownership and Self-referral in Hospitals: Research on Negative Effects Grows April 2008. The number of physician-owned, limited-service hospitals continues to grow. Chart 1: Number of Physician-owned, Limited-service Hospitals, 2000-2007. Suspension. Moratorium Imposed.

E N D
Physician Ownership and Self-referral in Hospitals: Research on Negative Effects GrowsApril 2008
The number of physician-owned, limited-service hospitals continues to grow. Chart 1: Number of Physician-owned, Limited-service Hospitals, 2000-2007 Suspension Moratorium Imposed Facilities in Development Suspension Lifted Source: American Hospital Association analysis of state surveys and CMS data, 2007. Number of facilities per year is based on the Medicare certification date.
Most states have some physician-owned, limited-service hospitals… Chart 2: Estimated Number of Physician-owned, Limited-service Hospitals* in the U.S., 2007 No Facilities 1-10 Facilities 11-20 Facilities 21+ Facilities Source: American Hospital Association analysis of state surveys and CMS data, 2007. *Includes facilities established and under development as of second quarter 2007.
…but might Texas foretell the future national landscape? Chart 3: Community Hospitals and Existing and Planned Physician-owned Hospitals in North Texas Source: AHA survey of states and hospital systems. Excludes rehabilitation, long-term care and psychiatric hospitals.
Physician ownership influences where physicians refer patients for care. Chart 4: Percent of Physician-owners Referring the Majority of Medicare Cases to Their Own Hospital by Ownership Share, 2003 Individual Physician Share of Ownership Source: Greenwald, L., et al. (2006). Specialty versus Community Hospitals: Referrals, Quality, and Community Benefits. Health Affairs, 25(1), 106-118. Note: Based on ownership data from Tucson, AZ, Fresno, CA, Hot Springs, AR, Oklahoma City, OK, Rapid City, SD, and Dayton, OH.
Physician-owned, limited-service hospitals drive up procedure volumes. Chart 5: Number of Complex Spinal Fusion Procedures per 1,000 Workers with Diagnosed Back/Spine Disorders Receiving Treatment in Oklahoma City, 1999-2004 Physician-owned Hospital Opened, Nov. 1999 Source: Mitchell, J.M. (2007). Utilization Changes Following Market Entry by Physician-owned Specialty Hospitals. Medical Care Research and Review, 64(4), 395-415.
The rate of procedures grows faster in areas where physician-owned, limited-service hospitals enter. Chart 6: Number of Percutaneous Coronary Intervention Procedures per 10,000 Medicare Beneficiaries by Service in Hospital Referral Region (HRR)* Source: Nallamothu, B.K. (2007). Opening of Specialty Cardiac Hospitals and Use of Coronary Revascularization in Medicare Beneficiaries. JAMA, 297(9), 962-968. *Hospital referral regions are defined by the Dartmouth Atlas of Cardiovascular Health Care.
Physician-owned, limited-service hospitals have higher than average costs. Chart 7: Percent above National Average Medicare Cost per Discharge, Orthopedic/Surgical Hospitals versus Competitor Community Hospitals, FY 2004 Source: Medicare Payment Advisory Commission. (August 2006). Physician-owned Specialty Hospitals Revisited. Washington, DC. * Competitor community hospitals are in the same market as specialty hospitals and provide similar services.
Two-thirds of physician-owned hospitals use 9-1-1 as part of their emergency response procedures. Chart 8: Percent of Physician-owned, Limited-service Hospitals by 9-1-1 Usage, 2007 Source: Office of Inspector General. (January 2008). Physician-owned Specialty Hospitals’ Ability to Manage Medical Emergencies. Washington, DC.
Physician-owned hospitals treat a smaller share of Medicaid patients. Chart 9: Median Percent of Medicaid Patients by Service and Hospital Type, FY 2004 Source: Medicare Payment Advisory Commission.(August 2006). Physician-owned Specialty Hospitals Revisited. Washington, DC.
Community hospitals have a more diverse patient mix. Chart 10: Racial and Ethnic Minorities as a Percent of Total Medicare Discharges by Hospital Type, 2002 Source: Medicare Payment Advisory Commission. (May 2005). Medicare Admissions by Type of Hospital and Race. Washington, DC.
While about half of physician-owned hospitals have an emergency department… Chart 11: Percent of Hospitals by Emergency Department Presence, Physician-owned Specialty Hospitals versus Community Hospitals, 2007 Source: Office of Inspector General. (January 2008). Physician-owned Specialty Hospitals’ Ability to Manage Medical Emergencies. Washington, DC.
…the majority have only one emergency bed. Chart 12: Percent of Physician-owned, Limited-service Hospitals with Emergency Departments by Number of Emergency Beds, 2007 Source: Office of Inspector General. (January 2008). Physician-owned Specialty Hospitals’ Ability to Manage Medical Emergencies. Washington, DC. *One hospital with an emergency department shares the emergency beds of an adjacent hospital.
Orthopedic Surgery Cardiac Community hospitals treat patients with more severe conditions. Chart 13: Percent of Discharges in Major/Extreme* Severity Categories, 2003 Source: Centers for Medicare & Medicaid Services. (May 2005). Study of Physician-owned Specialty Hospitals Required in Section 507(c)(2) of the Medicare Prescription Drug, Improvement, and Modernization Act of 2003. Washington, DC. Note: Competitor hospitals include community hospitals within 20 miles of a specialty hospital. * Severity based on APR-DRG system. “Major/extreme” severity of illness categorizations are characterized by multiple serious diseases and the interactions between the disorders. “Moderate” or “Minor” severity classifications (not shown) typically do not have complicating secondary diagnoses.
Specialty hospitals have high expected profits due to the mix of cases they treat. Chart 14: Percent above National Average Profitability Due to Favorable Case Mix Selection, by Type of Hospital Source: Medicare Payment Advisory Commission. (March 2005). Physician-owned Specialty Hospitals. Washington, DC. Note: Favorable case mix is due to selection of DRGs and patient severity.