Download
1 / 9
90 likes | 214 Views

E N D
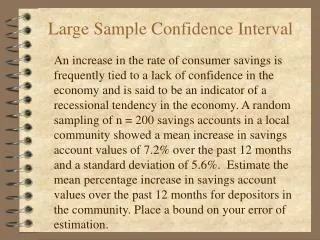
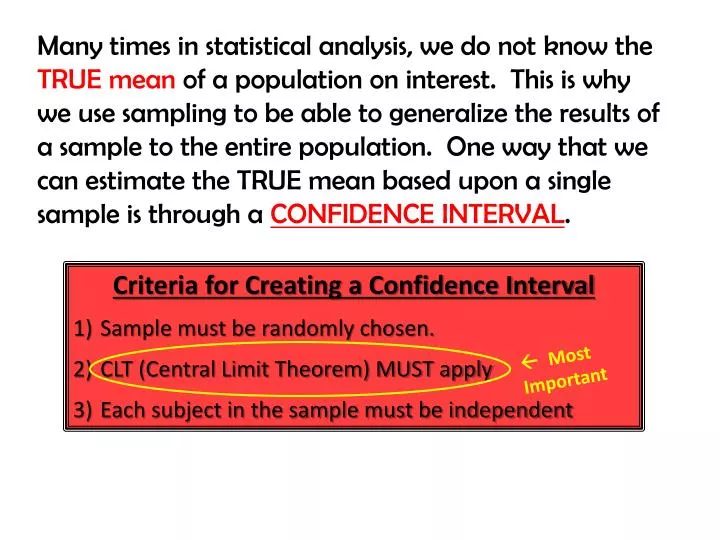
Many times in statistical analysis, we do not know the TRUE mean of a population on interest. This is why we use sampling to be able to generalize the results of a sample to the entire population. One way that we can estimate the TRUE mean based upon a single sample is through a CONFIDENCE INTERVAL. Criteria for Creating a Confidence Interval Sample must be randomly chosen. CLT (Central Limit Theorem) MUST apply Each subject in the sample must be independent Most Important
Central Limit Theorem Regardless of the shape of the original population distribution, if a sample size is large enough (), then the sampling distribution of means will be normally distributed.
The idea of a confidence interval is based upon a statistic (a mean or proportion) of the sample &confidence level (a %). Once you have the statistic and a margin of error based on the confidence level, a range of numbers is established that is believed to enclose the TRUE mean of the population from which the sample originated. Sample mean TRUE mean will fall somewhere within this interval
To find this interval, we need to know the z-score (the number of standard deviations) above and below the middle that will enclose the desired confidence level (%). We can get this from the z-score table and our knowledge of the bell curve. Look up the lower tail’s % on the table for the z-score The z-score that cuts off the desired confidence level is called a critical value (z*) This is the critical value for an 80% confidence level
Finding Critical Values for Confidence Levels Using desired confidence level, find % on the TAIL of the normal curve. Look up that % (or as close as you can get) on the INSIDE of the z-score table Follow that value over and out to get the matching critical value (z-score) Tail %
What would be the critical values for the following common confidence levels? Draw a bell curve to help with finding the percentages needed. 90% ………………………………………………………… 95% ........................................................... 99% …………………………………………………………. 1.645 1.96 2.575
Once you have the critical value, you can calculate the interval by using the following formula. Confidence Interval = statistic ± z* ∙ standard error For estimating the population MEAN, the formula would be… This is under the assumption that we know the standard deviation of the population (s)
A simple random sample of the height of the 28 students in Ms. Crayton’s class was recorded.. The mean of the sample is 64 inches and the standard deviation is 8 . A) Create a 90% Confidence Interval for the TRUE mean height of the students in her class. B) Create a 99% Confidence Interval for the True mean in her class. What is the CI interpretation of heights of the students?