Download
1 / 12
210 likes | 752 Views
Lean Process Improvement and Value Stream Mapping. Clayton State University Kelley Hundt Paul Todd. What is Lean Enterprise?. Defining, identifying, and eliminating waste of time and resources Using the scientific method to make improvements

E N D
Lean Process ImprovementandValue Stream Mapping Clayton State University Kelley Hundt Paul Todd
What is Lean Enterprise? • Defining, identifying, and eliminating waste of time and resources • Using the scientific method to make improvements • A strategy for decreasing the time from concept to implementation • 10% Tools, 90% People
Definitions Value Added Activities (MAXIMIZE) Activities that transform a product or service into the end-state. Non Value Added Activities (MINIMIZE OR ELIMINATE) Activities that DO NOT transform the product or service into the end-state. Regulatory activities that take time away from completing student focused tasks. Your headaches!!
Muda = 8 Wastes • Defects – Errors and Rework • Overproduction – Making more than needed; duplication of services/software/solutions owned by the University • Waiting – Deciding, Inadequate Information, Interruptions • Non Using Ideas – Unshared Knowledge • Transportation – Moving Information, Equipment • Inventory – Supplies or Students • Motion – Searching and Traveling • Extra Processing – Variation, Repetition, Ineffective Policies
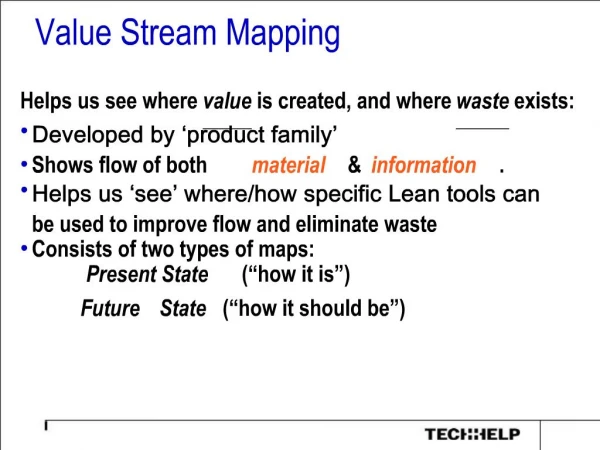
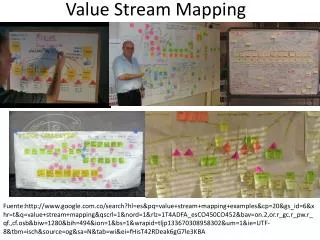
What is a Value Stream Map? All activities related to efforts to identify and integrate technologies into courses. The team is made up of faculty and staff that deal with the process and “headaches” every day. “Win small, Win early, Win often”
Value Stream Map Agenda Training on Lean Principles Develop the “Before” Picture of Process Observe the Process: Go to the “Gemba” Data Analysis of the Process: Lead-time vs. Process Time Brainstorm on Improvement Idea Develop the “Ideal” Process Prioritize Ideas Define Projects Develop an “Action” List Presentation to Leadership
Goals & Objectives Goals Develop a standard approach to: Create a transparent process providing reliable access to data, decisions, and performance measures regarding IT budgets, policies, and services to support IT project requests made by the Academic IT Committee. Provide clear direction and communication regarding policies and procedures to implement IT projects at Clayton State. Identify training, support, and budget (one-time and ongoing) to successfully implement the technology. Create a reusable method to apply to other process problems Objectives: Map the current processes involved from idea conception to full implementation noting the values added, subtracted for each process and group involved. Develop a vision of the most optimal processes to include in the Information Technology Council and the newly formed Academic IT committee. Develop a measured approach to transition to that vision. Implement the plan.
VA, NVA & ENVA Emergency Dept. Example
Current State Map Process Lead-times: New to Resume Submitted 4 days avg. (range 0-36 days) Resume Submitted to Interview 7 days avg. (range 0-59 days) Interview to Offer 5 days avg. (range 0-21 days) Offer to Background Complete 6 days avg. (range: 0-34 days) Background to Orientation Complete 16 days avg. (range: -7- 43 days) New to Orientation Complete 37 days avg. (range 9-80 days) New to “Hired” 28 days avg. (range 2-59 days)
Team Observations • Process varies greatly on a location by location basis • Multiple phone calls (asking the same questions) to candidates prior to the interview • Applicants get “lost” in the process • Incorrect submission of New Hire paperwork • Difficult to get Employee ID for Mosby training – some locations get it early, others don’ts • Some locations “un-hire” 25% of new hires during the orientation
Future State Projected Total Lead-time 17 days avg. Projected Process Lead-times: New to Resume Submitted 1 day avg. Resume Submitted to Phone Screen 2 days avg. Phone Screen to Assessment Center 4 days avg. Assessment Center to Cont. Offer 1 days avg. Cont. Offer to Orientation Start 7 days avg. Orientation Start to Orientation Complete 2 days avg.