Download
1 / 53
540 likes | 668 Views
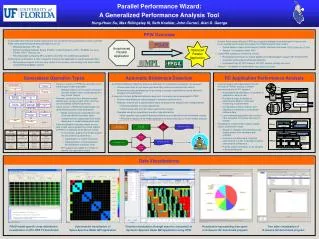
Dynaprof and PAPI A Tool for Dynamic Runtime Instrumentation and Performance Analysis. Philip Mucci, Research Consultant Innovative Computing Laboratory/LBNL mucci@cs.utk.edu http://icl.cs.utk.edu/projects/papi http://www.cs.utk.edu/~mucci/dynaprof. The ICL PAPI Team. Jack Dongarra

E N D
Dynaprof and PAPIA Tool for Dynamic Runtime Instrumentation and Performance Analysis Philip Mucci, Research Consultant Innovative Computing Laboratory/LBNL mucci@cs.utk.edu http://icl.cs.utk.edu/projects/papi http://www.cs.utk.edu/~mucci/dynaprof
The ICL PAPI Team Jack Dongarra Kevin London Shirley Moore Philip Mucci Keith Seymour Dan Terpstra Haihang You Min Zhou And a few of you spread throughout the globe…
The Library Interface PAPI provides two APIs to access the underlying counter hardware: • The low level interface manages hardware events in user defined groups called EventSets. • The high level interface simply provides the ability to start, stop and read the counters for a specified list of events.
PAPIImplementation Tools PAPI Low Level PAPI High Level Portable Layer PAPI Machine Dependent Substrate Machine Specific Layer Kernel Extension Operating System Hardware Performance Counters
Preset Events • Proposed standard set of event names deemed most relevant for application performance tuning • No standardization of the exact definition • Mapped to native events on a given platform
Preset Events 2 • PAPI supports 92 preset events and native events. • Preset events are mappings from symbolic names to machine specific definitions for a particular hardware resource. • Example: Total Cycles is PAPI_TOT_CYC • PAPI also supports preset that may be derived from the underlying hardware metrics • Example: Floating Point Instructions per Second is PAPI_FLOPS
Native Events • An event countable by the CPU can be counted even if there is no matching preset PAPI event • Same interface as when setting up a preset event, but a CPU-specific bit pattern is used instead of the PAPI event definition
Sample Preset Listing > tests/avail Test case 8: Available events and hardware information. ------------------------------------------------------------------------- Vendor string and code : GenuineIntel (-1) Model string and code : Celeron (Mendocino) (6) CPU revision : 10.000000 CPU Megahertz : 366.504944 ------------------------------------------------------------------------- Name Code Avail Deriv Description (Note) PAPI_L1_DCM 0x80000000 Yes No Level 1 data cache misses PAPI_L1_ICM 0x80000001 Yes No Level 1 instruction cache misses PAPI_L2_DCM 0x80000002 No No Level 2 data cache misses PAPI_L2_ICM 0x80000003 No No Level 2 instruction cache misses PAPI_L3_DCM 0x80000004 No No Level 3 data cache misses PAPI_L3_ICM 0x80000005 No No Level 3 instruction cache misses PAPI_L1_TCM 0x80000006 Yes Yes Level 1 cache misses PAPI_L2_TCM 0x80000007 Yes No Level 2 cache misses PAPI_L3_TCM 0x80000008 No No Level 3 cache misses PAPI_CA_SNP 0x80000009 No No Requests for a snoop PAPI_CA_SHR 0x8000000a No No Requests for shared cache line PAPI_CA_CLN 0x8000000b No No Requests for clean cache line PAPI_CA_INV 0x8000000c No No Requests for cache line inv. . . http://icl.cs.utk.edu/projects/papi/files/html_man/papi_presets.html
High-level Interface • Meant for application programmers wanting coarse-grained measurements • Not thread safe • Calls the lower level API • Allows only PAPI preset events • Easier to use and less setup (additional code) than low-level
High-level API Calls • PAPI_num_counters() • Returns the number of available counters • PAPI_start_counters(int *cntrs, int alen) • Start counters • PAPI_stop_counters(long_long *vals, int alen) • Stop counters and put counter values in array • PAPI_accum_counters(long_long *vals, int alen) • Accumulate counters into array and reset • PAPI_read_counters(long_long *vals, int alen) • Copy counter values into array and reset counters • PAPI_flops(float *rtime, float *ptime, long_long *flpins, float *mflops) • Wallclock time, process time, FP ins since start, • Mflop/s since last call
Low-level Interface • Increased efficiency and functionality over the high level PAPI interface • Approximately 56 functions (http://icl.cs.utk.edu/projects/papi/files/html_man/papi.html#4) • Thread-safe (SMP, OpenMP, Pthreads) • Supports both presets and native events
Low-level Functionality • API Calls for: • Counter multiplexing • Callbacks on counter overflow • SVR4 compatible profiling • Hardware information • Software information • Highly accurate and low latency timing functions • Hardware event inquiry functions • Eventset management functions • Simple locking operations
The Cost of Calling PAPI • PAPI includes an example program cost to measure latencies • Reading hardware counters is relatively cheap • Setup is a bit more expensive as it sometimes requires a system call
PAPI and Threads • A challenge: how to make one version of a library that works with *any* thread model? • After initializing the library, the user needs to enable thread detection • Each thread responsible for creation, start, stop and read of its own counters
PAPI and Multiplexing • Multiplexing allows simultaneous use of more counters than are supported by the hardware. • This is accomplished through timesharing the counter hardware and extrapolating the results. • Users can enable multiplexing with one API call and then use PAPI normally. • Implementation was based on MPX done by John May at LLNL.
PAPI and Multiplexing 2 • Most platforms do not support multiplexing at the kernel level. • PAPI implements multiplexing in software at the user level. • The more events you multiplex, the larger the sampling error in the result. • Too short of a measurement interval will result in 0 counts.
Interrupts on Counter Overflow • PAPI provides the ability to call user-defined handlers when a specified event exceeds a specified threshold. • For systems that do not support counter overflow at the hardware level, PAPI emulates this in software at the user level.
Hardware Statistical Profiling • On overflow of hardware counter, dispatch a signal/interrupt. • Get the address at which the code was interrupted. • Store counts of interrupts for each address. • GNU prof and gprof (-pg and –p compiler options) use interval timers.
SVR4 Compatible Profiling • PAPI provides support for SVR4-compatible execution profiling based on any counter event. • PAPI_profil() creates a histogram of overflow counts for a specified region of the application code.
Results of Statistical Profiling • The result: A probabilistic distribution of where the code spent its time and why. Event Count Program Text Addresses
Some Tools that use PAPI • DEEP/PAPI (Pacific Sierra) http://www.psrv.com/deep_papi_top.html • TAU (Allen Mallony, U of Oregon) http://www.cs.uoregon.edu/research/paracomp/tau/ • SvPablo (Dan Reed, U of Illinois) http://vibes.cs.uiuc.edu/Software/SvPablo/svPablo.htm • Cactus (Ed Seidel, Max Plank/U of Illinois) http://www.aei-potsdam.mpg.de • Vprof (Curtis Janssen, Sandia Livermore Lab) http://aros.ca.sandia.gov/~cljanss/perf/vprof/ • Tool Gear/MPX (John M, John G, LLNL) • Cluster Tools (Al Geist, ORNL) • Paradyn (Barton Miller, U Wisc.) http://www.paradyn.org
For More Information • http://icl.cs.utk.edu/projects/papi/ • Software and documentation • Reference materials • Papers and presentations • Third-party tools • Mailing lists
2.1 Release Platforms IBM AIX 4.3.x + pmtoolkit PPC604, 604e, Power 3 X86 + perfctr 2.3.x Development version Power 3, 604e AIX 5.1 Power 4 Itanium / Itanium 2 + kernel 2.4.18 or higher V3.0 Pentium 4 IBM PAPI Release Platforms
Additional Platforms Itanium Itanium 2 Power 4 AIX 5, Power 3 AIX 5, PPC604e PAPI 3.0 binary Pentium 4 Sample Tools Perfometer Trapper Dynaprof Upcoming PAPI 2.3 Release
PAPI 3.0 • Using lessons learned from years earlier • Substrate code: 90% used only 10% of the time • In practice, it was never used • Redesign for: • Robustness • Feature set • Simplicity • Portability to new platforms
PAPI 3.0 Features • Multiway multiplexing • Use all available counter registers instead of one per time slice. (Just 1 additional register means 2x increase in accuracy) • Superb performance • Pentium 4, a PAPI_read() costs 230 cycles. • Register access alone costs 100 cycles. • System level counting interface • Programmable events • Thresholding • Instruction matching • Per event counting domains
PAPI 3.0 Features 2 • Remote control interface • Allows PAPI to control counters in multiple threads/processes • High level API becomes thread safe • Internal timer/signal/thread abstractions • Additional internal layered API to support robust extensions like: • MPX from Lawrence Livermore • Kevin London’s memory extensions • Remote control interface from U. Wisc.
PAPI 3.0 Features 3 • New language bindings • Java • Lisp • Matlab
PAPI 3.0 Release Targets • Supercomputing release for Pentium 4, possibly more… • Future work • New platforms • Earth Simulator / SX-6 • Blue Gene (BG/L 64k nodes)
What is DynaProf? • A portable tool to dynamically instrument serial and parallel programs for the purpose of performance analysis. • Simple and intuitive command line interface like GDB. • Java/Swing GUI. • Instrumentation is done through the run-time insertion of function calls to specially developed performance probes.
DynaProf Goals • Make collection of run-time performance data easy by: • Avoiding instrumentation and recompilation • Avoiding perturbation of compiler optimizations • Using the same tool with different probes • Providing useful and meaningful probe data • Providing different kinds of probes • Allowing custom probes • Providing complete language independence • Allowing multiple insert/remove instrumentation cycles No source code required!
A Brief History of Dynamic Instrumentation • Popularized by James Larus with EEL: An Executable Editor Library at U. Wisc. • http://www.cs.wisc.edu/~larus/eel.html • Technology matured by Dr. Bart Miller and (now Dr.) Jeff Hollingsworth at U. Wisc. • DynInst Project at U. Maryland • http://www.dyninst.org/ • IBM’s DPCL: A Distributed DynInst • http://oss.software.ibm.com/dpcl/
Dynamic Instrumentation • Operates on a running executable. • Identifies instrumentation points where code can be inserted. • Inserts code snippets at selected points. • Snippets can collect and monitor performance information. • Snippets can be removed and reinserted dynamically.
Why the “Dyna” in DynaProf? • Built on DynInst and DPCL • Instrumentation is dynamically and selectively inserted directly into the program’s address space. • Why is this a better way? • No perturbation of compiler optimizations • Complete language independence • Multiple Insert/Remove instrumentation cycles
DynaProf Commands load attach list use instr module | function stop continue run info unload
Dynaprof Sample Session $./dynaprof (dynaprof) load tests/swim (dynaprof) list DEFAULT_MODULE swim.F libm.so.6 libc.so.6 (dynaprof) list swim.F MAIN__ inital_ calc1_ calc2_ calc3z_ calc3_ (dynaprof) list swim.F MAIN__ Entry Call s_wsle Call do_lio Call e_wsle Call s_wsle Call do_lio Call e_wsle Call calc3_ (dynaprof) use probes/papiprobe Module papiprobe.so was loaded. Module libpapi.so was loaded. Module libperfctr.so was loaded. (dynaprof) instr module swim.F calc* swim.F, inserted 6 instrumentation points (dynaprof) run papiprobe: output goes to /home/mucci/dynaprof/tests/swim.1671
DynaProf Probe Design • Probes export 2 functions with loosely standardized interfaces. • Very easy to roll your own. • Supports separate probes for MPI/OpenMP/Pthreads. • Probes do their own data collection and visualization.
Dynaprof v0.7 Probes • papiprobe • Measure any combination of PAPI presets and native events • wallclockprobe • Highly accurate elapsed wallclock time in microseconds. • These probes report • Inclusive • Exclusive • 1 Level Call Tree
Supported Platforms Using DynInst Linux 2.x AIX 4.3 Solaris 2.8 IRIX 6.x Using DPCL AIX 4.3 AIX 5? Available as a binary package from: http://www.cs.utk.edu/~mucci/dynaprof Perfapi-devel@ptools.org No GUI included User’s Guide All probe libraries included Dynaprof v0.7 Release
PAPI Probe v0.7 Features • Can count any PAPI preset or Native event accessible through PAPI • Can count multiple events • Supports multiplexing • Supports multithreading • AIX: SMP, OpenMP, Pthreads • Linux: SMP, OpenMP, Pthreads
Wallclock Probe v0.7 Features • Counts microseconds using RTC • Supports multithreading • AIX: SMP, OpenMP, Pthreads • Linux: SMP, OpenMP, Pthreads
PAPI Probe v0.7 Output Output file : /home/mucci/dynaprof/tests/swim.1385 Option string : PAPI_TOT_CYC,PAPI_TOT_INS Processor : 363 Mhz GenuineIntel Intel Pentium II rev 0xa (1-way) Total metrics measured : 2 Metric 1: : PAPI_TOT_CYC, Total cycles (Native 0x79,0x79) Metric 2: : PAPI_TOT_INS, Instructions completed (Native 0xc0,0xc0) Total functions : 6 Exclusive Profile of Metric PAPI_TOT_CYC. Name Percent Total Calls ------------- ------- ----- ----- TOTAL 100 2.583e+10 1 calc2_ 32.02 8.271e+09 120 calc3_ 31.54 8.147e+09 118 calc1_ 30.84 7.966e+09 120 unknown 2.759 7.125e+08 1 inital_ 2.503 6.465e+08 1 calc3z_ 0.1698 4.387e+07 1 MAIN__ 0.1639 4.235e+07 1 Inclusive Profile of Metric PAPI_TOT_INS. Name Percent Total SubCalls ------------- ------- ----- -------- TOTAL 100 2.408e+10 0 MAIN__ 100 2.408e+10 424 calc1_ 34.27 8.251e+09 0 calc2_ 33.48 8.06e+09 0 calc3_ 27.94 6.726e+09 0 inital_ 4.073 9.806e+08 1.053e+06 calc3z_ 0.1257 3.027e+07 0
PAPI Probe v0.7 Output 1-Level Inclusive Call Tree of Metric PAPI_TOT_INS. Parent/-Child Percent Total Calls ------------- ------- ----- -------- TOTAL 100 2.408e+10 1 MAIN__ 100 2.408e+10 1 - s_wsle 2.92e-06 703 1 - do_lio 3.14e-06 756 1 - e_wsle 4.515e-06 1087 1 - inital_ 4.073 9.806e+08 1 - s_wsfe 2.427e-05 5843 1 - do_fio 2.141e-05 5154 1 - do_fio 1.251e-05 3012 1 - e_wsfe 5.728e-06 1379 1 - calc1_ 0.2856 6.876e+07 120 - calc2_ 0.279 6.717e+07 120 - s_wsfe 8.278e-06 1993 2 - do_fio 2.676e-05 6443 2 - e_wsfe 7.385e-06 1778 2 - s_stop 0 0 1 - calc3z_ 0.1257 3.027e+07 1 - calc3_ 0.2367 5.7e+07 118 inital_ 100 9.806e+08 1 - atan 0.0001985 1946 1 - sin 0.0002003 1964 2.632e+05 - sin 6.364e-05 624 2.632e+05 - cos 0.0002101 2060 2.632e+05 - cos 6.353e-05 623 2.632e+05 calc1_ 100 8.251e+09 120 calc2_ 100 8.06e+09 120 calc3z_ 100 3.027e+07 1 calc3_ 100 6.726e+09 118
Dynaprof v0.8 • 3+ probes, including perfometerprobe • All support all threading models • Pthreads • OpenMP directives • SMP directives • GUI included • Same release targets
DynaProf GUI • Displays module tree for instrumentation • Simple selection of probes and instrumentation points • Single-click execution of common DynaProf commands • Coupling of probes and visualizers (e.g. perfometer)
Perfometer Probe v0.8 • Graphically monitor performance in near real time. • To be rereleased in v0.8 with full thread support on all platforms. • Robust error handling.